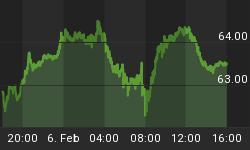
Firstly What is the VIX? This is an index of implied volatility of the Chicago Board Options on the S&P 500 stock index, The exchange calculates the implied volatility of eight at-the-money or near-the-money strikes (both puts and calls) with a weighted average time to maturity of 30 days. Basically the VIX is a measure of fear in the market. It rises when investors are fearful, as more options are bought, and falls when investors feel less fearful, so buy less options to manage their stock market risk.

The VIX for some months has been trading at and to new multi-year lows, having hit a 13 year low on Friday, whilst the Dow jones powers to new highs and other stock market indices trading at 5 year highs. This low level of fear indicates high complacency amongst investors and is highly indicative of greater future volatility, which suggests a sharp fall in stock prices. A lot of this complacency is due to December historically being seen as a positive month for the stock markets, and to date that is exactly the script the Dow Jones, S&P and FTSE 100 index have been following.
The VIX is warning, that despite the strength of the market during December, which given history is likely to continue into the end of the month, January and much of early 2007 is likely to see a sharp drop on Share prices, to bring FEAR back into the market. As ALWAYS one indicator should never be used in isolation, the view that early 2007 will see a sharp drop in share prices is also borne out by MACD indicator which is moving towards an overbought state by the end of 2006, and also the failure of the Dow Jones Transports to confirm the new highs in the Dow Jones Industrials which is a clear sign of non confirmation.
Additionally a recent survey by UBS of its client base on Investor Optimism, had the highest readings since June 2004, which was followed by a fall in the stock markets.
The triggering factor for the sharp decline in the stock market during early 2007 would be clear fundamental evidence of a sharp slowdown in the US economy such as further declines in the housing market, a slump in the dollar, or a contraction in consumer spending.


