


Seven months of a lateral trend and still counting. Neither war nor famine nor energy volatility seems to wake this sleeper of a gold trend. Maybe next week.
GOLD
LONG TERM
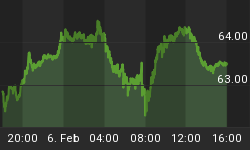
Unless there enters some significant action it is a waste of time to show a long term chart each week. The intermediate term chart below will do double duty.
The lateral trend is now seven months long and counting. There does not seem to be a resolution to the trend anywhere in sight, at least not a significant hint. The long term prognosis is almost a continuing repeat. Price is above its long term moving average line but the line is still very slightly pointing downward. If we take the line movement over the past several weeks it can only be classified as neutral, basically moving sideways. Momentum continues to stay above its neutral line but is not showing any great strength, basically neutral with a mild positive strength. The volume indicator seems to be going through a long term topping activity with its trigger line already turned downward. The long term P&F chart remains in a wide lateral mode but with the last signal being a bear signal and still nowhere close to a reversal.
I turned BEARISH a couple of weeks ago and still see no reason to reverse, although a NEUTRAL rating might be more appropriate.
BULLISH, BEARISH and NEUTRAL
Just a brief note for new readers (and a reminder for the old ones). When I say I am bullish or bearish on the long term or intermediate term I do not mean to imply that that is where I expect the price to be, in the long term or intermediate term (or short term). I am not a fortune teller, could never master the art. There are many other analysts out there who do predict where the price WILL BE in 10 weeks, 40 weeks, or whatever. Technical analysis is the study of PAST price/volume action to determine the PRESENT position of a security and the PRESENT direction of the security trend. By the use of different parameters one can filter out different activity in the security action so that the information one obtains is relevant to different investment time periods. One can determine what the PRESENT position of a security may be if one has a long term focus or by changing some parameters one can determine the PRESENT position of a security if one has an intermediate term focus. Although the price action is the same the final determination may be different for the two periods. The long term position of the security today may be bullish while the intermediate term position of the same security today may be bearish. Both may be correct using their respective indicators.
Keeping the above in mind, a bullish prognosis one week can easily change to a bearish prognosis in a few short weeks even if such prognosis is from a long term stand point. All it says is that the technical information had changed in the few weeks, enough to change the new PRESENT position of the price trend.
I do provide from time to time projections as to the level that I expect the price to reach. These projections are almost always (but not necessarily always) based upon the point and figure charts. However, although this method may provide a guide as to where one might expect a price to go the method DOES NOT predict as to when such projection will be reached. In most cases one should expect the price to be met during one's lifetime but there is nothing in the method that guarantees such timing.
INTERMEDIATE TERM
There is nothing much in the P&F chart this week so I'll leave it till next week. There are a few interesting features in the intermediate term chart on the next page so let's focus on that.

The chart shows the final action leading to the May top and the subsequent lateral motion since. Before going to our normal indicators let's see what else we have here.
First, we have a very strong support line which has been touched three times with a rally after each touch. Any downside action will have to contend with this line. A breaking of this line would be a serious omen.
We have a decelerating bullish FAN trend lines. I'm not sure how much credence to place on these FAN trend lines as the usual situation is a down trend that is losing strength (decelerating) but still moving lower. Here, however, we do not have any further down trend after the first FAN line. We'll just have to watch and learn from this pattern.
Not adequately shown but we still have what some technicians would call a head and shoulder pattern. The left shoulder can be seen last Feb/March while the right shoulder has become quite extended. As the action since Aug has not penetrated either the high in July or the low in June one might say that the subsequent action is just an extension of the initial right shoulder. I don't particularly go with such explanation but it may prove true yet.
Looking at major intermediate term moves, we have since the May top and June bottom, lower highs and higher lows. We await one or the other of these to be broken. It is looking like the break might come on the up side but let's not jump the gun and just wait for it to happen. Always make room for surprises.
One can see the lateral nature of the action for the past several months in the trend of the two basic indicators, the On-Balance Volume and 50 Day RSI. The volume indicator has recently shown weakness by moving to its support that dates back to the May top period. The past few days has seen a bounce off this support but it does not yet look impressive. The volume indicator trigger line is still pointing downward and the indicator is still below the trigger line. As for the RSI, this momentum indicator continues to gyrate above and below its neutral line with little strength to really get anywhere. The price is once more above its intermediate term moving average line and the line has once more turned up.
I had been bearish on the intermediate term but with the up and down activity the NEUTRAL stand seems to be the more appropriate for now.
SHORT TERM

Short term we are in somewhat of a rally. How much longer that rally will go is debatable. Signs point to continuation of the rally but we sure could use some stronger action than we have had. The price is above its positive short term moving average line (15 DMAw). Momentum (13 Day RSI) moved into the positive zone some several days ago and remains there. The short term trend is bullish and is not showing immediate signs of stopping.
IMMEDIATE TERM
A trend in motion remains in motion until confirmed otherwise. The odds are for a continuation of the up moves during the early part of the week but the Stochastic Oscillator (SO) is starting to hesitate. It had moved into the overbought zone where it remains. Friday's action in the SO is, however, weaker than the price rally might indicate so a surprise reversal is not out of the question. Expect more upside but a close below the $625 level would signal a reversal in the making.
NORTH AMERICAN GOLD INDICES
Today let's look at the new S&P/TSX Global Gold Index. It's the same old S&P/TSX Capped Gold Index from the past except with the inclusion of several gold stocks traded in the US market. This new Global Index is intended to be a more varied Index representing companies from the US and South Africa (traded in the US market). Although the Index is barely a month old it is nothing other than a continuation of the old Index values.
The Index had been setting up a head and shoulder pattern (as most gold Indices were doing) but as the time dragged on the pattern has now become too broad on the right hand side and one might consider the H&S as gone. There still remains a very solid support which had previously been the H&S neckline.

Shown in the chart is a long term momentum indicator, daily data version. As we can see it is still in the positive zone but heading lower. It had breached the neutral line entering the negative zone twice recently but each time it quickly reversed and rallied. We'll have to see what happens this time.
For now there is just too much volatility to go bull or bear so it's NEUTRAL until a more decisive trend takes hold.
MERV'S PRECIOUS METALS INDICES
It's interesting to note that although almost all the major North American gold indices had exhibited a head and shoulder pattern only the Merv's Qual-Gold had done so. All of the other Merv's Indices did not. This was due to the fact that the Merv's Indices did not have a rest period early in 2006 to cause the left shoulder. In addition, the Merv's Indices have had a much more vigorous rally in the past few months than had the major Indices thereby negating any right shoulder should they have had one.
It was generally a negative week in the stock section of the precious metals. Gold and silver themselves were up on the week but the stock Indices were mostly down, although by only a very small fraction. Two of Merv's Indices actually advanced on the week but only the Merv's Gamb-Gold Index did by more than a % point. I guess the speculators are waiting another week to see what the situation holds. I would caution investor/speculators to not jump the gun and assume which way events will unfold. More money is lost by assuming wrong and then not having the concept of taking small losses firmly in mind. It is human nature to wait some time before admitting a mistake when one happens. In the markets, that's a disaster.
Looking at the Merv's Composite Index of Precious Metals Indices we see very little movement this week. Both the long and intermediate term momentum indicators are still in their positive zones and the Index is still above its very slightly positive long term moving average line. It is, however, below its negatively sloping intermediate term moving average line. So, the Composite Index may be considered as still bullish from the long term perspective and neutral from the intermediate term perspective.
MERV'S GOLD & SILVER 160 INDEX

The average performance of the universe of 160 precious metal stocks continues to show weakness. After the super one year rise from the May 2005 low, the activity has been basically a downer. The rally since October was quite solid but did not have the momentum to really carry it very far. The Index is once more looking like it wants to seek lower levels. The long term momentum has been positive since breaking through its neutral line in mid-July of 2005, after only a brief spell below the line. One can view the lack of strength in the Index movement from this indicator. It still has a ways to go before going negative from the long term perspective but the odds are towards that direction more than further upside. With the Index some distance above its positive sloping long term moving average line we do not expect to go bearish soon but it is not the time for long term investing. Should the Index move above recent highs, THEN it may be time.
With minor variations the above analysis may be applied to all of the Sectors (Qual, Spec & Gamb) as well as to the silver Indices.
MERV'S PRECIOUS METALS INDICES TABLE

Click to open larger image in new window.


