


Market Wrap
Week Ending 1/19/07
The U.S. Economy
There were an inordinate amount of financial statements and reports buzzing about this past week. It seemed as if everyone had something to say about the markets or the economy.
Jim Rogers sated that oil will eventually change its present downward corrections and reverse upwards with $100 per barrel the projected price.
Most of the verbosity came from the Federal Reserve itself. Several different central bankers gave speeches or statements, saying that the economy was on firm footing and solid ground. BUT, they remained concerned and cautious over credit risk and debt accumulation (which well they should be).
Federal Reserve Governor Susan Bies said: "strong U.S. economic growth means there's a risk inflation may not slow as central bankers are forecasting. I would like to see something lower on inflation rates. The risks are still there that inflation may go up. Nevertheless, the risk to inflation continues to be on the upside until we see further confirmation in this trend towards moderation."
In a speech given in Ohio, Fed Governor Pinalto said: "the most recent price statistics have been encouraging, but not convincing. It is still too early to relax our concerns on price pressures."
Federal Reserve Governor Lacker had quite a bit to say: "It's going to take several months worth of data to provide statistically convincing evidence of a moderation of inflation. There is tentative evidence suggesting a moderating trend in inflation", Lacker stated. "In the meantime, the risk that core inflation surges again, or does not subside as desired, clearly remains the most predominant macroeconomic risk."
"There are tentative signs that the demand for housing has stabilized, gradually waning as the year progresses". An "overhang of savings abroad is helping to depress borrowing costs," he said.
"What would concern me -- and we have not seen this as yet -- would be a persistent increase in wage growth that was not matched by a commensurate increase in productivity growth. Ultimately an increase in wage growth of that type would lead to higher inflation pressures."
Not to be outdone, Senator Germane had the following to say during a Budget Committee hearing: "If early and meaningful action is not taken, the U.S. economy could be seriously weakened, with future generations bearing much of the cost."
Now some charts on the economy to ponder. Everything is said to be "perfect" in paper fiat land. My reply: "at what cost - and who is to pay that cost?"
Home Debt vs. Assets
First chart up is household debt as a percent of assets.
Household Debt vs. Assets
[Compliment of Fed's Z-1 Report]
Not the best of trends. Notice it relentlessly keeps climbing higher.
Home vs. GDP
Next is household debt as a percent of gross domestic product.
Household Debt vs. GDP
[Compliments of Federal Reserve Z-1 Report]
Home Mortgage
Mortgage Borrowing
[Compliment of Federal Reserve Z-1 Report]
Debt vs. Equity
Debt vs. Equity
[Compliments of BEA]
Outstanding Debt
Outstanding Debt
[Compliments Federal Reserve]
Equity vs. Value
Equity vs. Value
[Compliments of Federal Reserves Z-1]
Stocks
The Dow and S&P 500 hardly budged by week's end. The Transports gained a significant 2.0% and are moving towards confirming the Dow's high. The Utilities were up 0.7%, while the NASDAQ 100 fell 2.7%
The chart below shows the price action of the transports, which MAY be headed for a new high that will confirm the Dow's new high if it occurs. The price of oil may have something to say regarding the matter.

Nasdaq 100 Index
The chart below is the Nasdaq 100 - the largest 100 stocks in the Nasdaq. It just recently made a new high and has since fallen back.
If the low of 42.52 does not hold as support there could be trouble. The index set a new high at 45.40 and presently sits at 44.17.

QQQQ's vs. S&P 500
Next up is the chart of the Nasdaq 100 divided by the S&P 500. This ratio indicates what the risk tolerance of the market is. The Nasdaq stocks are riskier investments compared to the tried and blue S&P 500 stocks.
As such, when the Nasdaq 100 is out performing the S&P it is assumed that the market feels confident with the overall outlook for the market, and hence is willing to take on more risk.
When the S&P is out performing the Nasdaq 100 it means there is less risk tolerance and hence players seek the safety of the S&P 500.
Risk tolerance has just taken a turn for the worse. The S&P is far out performing the QQQQ's during the recent near term. The question is: was it just a blip or the start of a new trend?

Dow Industrials vs. Nasdaq Composite
The following chart illustrates the Dow Industrials divided by the Nasdaq Composite Index. This works according to the same premise behind the QQQQ's vs. the S&P 500.
When the Nasdaq is winning then there is more risk tolerance and confidence. When the Dow is winning there is risk aversion and the seeking of safety and shelter.

Dow vs. Gold
The chart below illustrates the relationship between the Dow Industrials and Gold. The higher the number the Dow is out performing gold. The lower the number gold is out performing the Dow. As you can see: gold has been killing the Dow for quite some time.

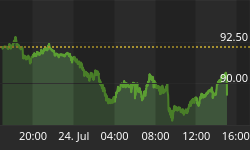
Ten Year Note

The chart above is of the ten year Treasury Note. Interest rates are steadily on the increase. This is NOT what the Fed wants.
The Fed wants an inverted yield curve (short term rates higher then long term rates) but they do not want both ends of the market to be rising resulting in higher interest rates even though the yield curve spread (difference between the short end and the long end) may remain the same.
Higher long term rates put pressure on mortgage holders, especially those with adjustable rate mortgages. Higher rates will also "turn off" many new home buyers who cannot afford the higher interest payments.
Higher rates, especially a sustained trend of higher rates, will be the death knell of the real estate market and other markets attached at the peripheral.
U.S. Treasuries fell after a report showed consumer confidence increased in January for the first time in three months.
For the week, two year Treasury yields gained 3.5 bps to 4.915%. Five year yields were up 1.5 bps to 4.78%. The ten year yield remained unchanged at 4.77%.
The 30 Year long bond yield also held steady at 4.86%. The spread between the two year and the ten year closed the week inverted 14.5 bps.
Below the is the 30 Year T-Bond divided by the 5 Year T-Note. As the chart illustrates, since April the ratio has been going sideways in a zone between 106-102.
If the resistance at 106 is broken through and above, it will mean higher rates are in the offing.

The Bank of Japan (BOJ) kept interest rates unchanged at 0.25%. Investor's had expected the BOJ to raise rates. The holding steady of rates spurred Japan's 10 year bonds to rally big time. The Yen was weak on the above news.
India reported that inflation increased at the fastest pace in two years. This led to speculation that India's central bank will increase interest rates at their next meeting. Investors sold Indian bonds on the news.
Fed Foreign Holdings of Treasury Debt was up $2.2 billion last week setting another record of $1.77 Trillion. Custody holdings added $240 billion or a 15.6% yearly increase.
U.S. Dollar & Currencies
The U.S. dollar index was down a mere 0.2% last week to 84.68. The Japanese yen fell 0.7%. The British Pound gained more than 2% since the Bank of England (BOE) raised interest rates last week.
The Swiss franc fell against the euro as investors continue to play the carry trade. Only Japan has lower interest rates then Switzerland.
The Bank of Japan silently endorsed the carry trade when it did not raise interest rates. Whether it was intentional or unintentional we will leave for the reader to decide.
The Yuan gained 0.31% to 7.7739 against the dollar as of Friday afternoon. The currency has risen 6.3% since the fixed exchange rate of 8.30 to the dollar ended in July 2005.
The Canadian Dollar rose ever so slightly against the US Dollar as speculators decreased their bets on a weaker Canadian Dollar. For the past month the Canadian Dollar has lost ground against the US Dollar causing currency traders to sell the CD$ and to buy the US$.
Traders decided to book profits on Friday causing the CD$ to rise against the US$. Since the price of crude oil has dropped precipitously the Canadian Dollar has lost over 6% against the U.S. Dollar.
The euro rose 11% against the dollar last year and hit a 2 year high of $1.3367 early in December. The euro was trading at $1.2958 mid-afternoon on Friday.
The chart below shows that the recent move up in the dollar was a bear market counter-trend rally that is presently bumping up into overhead resistance and is tiring and near its end - if it hasn't already reached the end of its rope.

International reserve assets, excluding gold were up $804 billion or almost 20% for another new record of $4.93 Trillion.
The chart below compares the performance of the US Dollar to that of gold. As is obvious from the chart - gold has been decimating the dollar.

Oil & Energy
Oil gains from 19-Month lows as cold temperatures and rising oil demand increase over much of the U.S. and especially New England and the East Coast. The Northeast accounts for 80% of total U.S. heating oil consumption.
Natural gas also rose for the fourth day out of the last five days on the same news of colder weather. Gas prices rose 4.7% this past week.
The International Energy Agency cut its estimate for global oil demand by 160,000 barrels a day and OPEC revised its estimate lower by 210,000 barrels.
The U.S. Dept of Energy reported that crude oil stockpiles expanded to 321.5 million barrels, a 9.3% increase compared to the five year average.
U.S. gasoline stockpiles were up for the fifth week in a row. Supplies jumped 3.5 million barrels to 216.8 million, an increase of 1.8% compared to the five year average.
In U.S. dollars, the price of U.S. benchmark crude, called West Texas Intermediate, has fallen almost 24% in the past 12 months.
The monthly chart of oil bellows shows some very interesting data. There have been four (4) serious corrections in the oil bull market to date. The present correction is by far the least of the four.
One correction is almost twice the magnitude as the present. Two of the four corrections have been approximately one year in length, and two have been about half a year in duration.

Commodities
The CRB index hardly budged for the week. Many individual commodities were down hard, while many others were up strong. All together they balanced one another out.
Gold was up 1.2% and Silver 0.4%. Copper continued down 2.7%. Crude lost another 86 cents to $52.02. Gasoline dropped 2.2%, and Natural Gas gained a large 5.3%.

Precious Metals Complex
Due to quite a few emails that I have been receiving concerning the recent action in the precious metals I'm going to offer several charts with comments showing different aspects of both the metals and the gold and silver stocks.
These relationships are known to analysts but are not often covered for whatever the reasons. They tell a tale a bit different then the present popular bearish consensus and they express a means to investing a bit differently then according to conventional or main stream thought.
Remember - these are charts based on factual data - they are not wishful thinking.
Also, please note that I have said many times that the ideological belief in gold and silver as Honest Money is completely different then speculation in the metals for profit. To mix the two produces a volatile mixture that can be hazardous to one's wealth and health. Caveat Emptor.
Buy and Hold
First, there are two basic ways of investing: one is a buy and hold strategy that buys early in a bull market and simply sits with the holdings until near the end of the bull and then sells. It is a proven strategy.
This is a very good strategy as it is simple, it is aligned with the long term trend, it requires little time and effort from the investor, and it reduces the risk of timing in and out purchases and sales.
There is a sub-set to this strategy that allows for buying additional positions on any intermediate term corrections. This is a very powerful tool that increases performance tremendously.
Playing Intermediate Term Moves
The second method of investing involves playing the intermediate term moves by buying and selling rather than simply buying and holding as above. Obviously this requires more of the investors time, and it subjects them to more risk as to the timing of the buying and selling.
Note, however, in the sub-set above to the buy and hold strategy was the option of adding to positions on weakness. Note how this is a powerful tool that can greatly magnify the returns of just sitting and holding.
Why is that? It is because you are adding additional holdings or positions during intermediate term weakness or corrections, which means at much cheaper prices. Buy low and sell high.
If it is acknowledged that buying into intermediate term weakness is a good strategy that supplements the buy and hold strategy, then it must be a good strategy period or on its own.
It also follows that if it is a good strategy to buy into weakness, it most also be a good strategy to sell into strength or into intermediate term rally highs.
So now it becomes a question of timing: how to know when to sell into weakness or intermediate term corrections or bottoms; and when to sell into intermediate term rally highs.
One caveat: no one can discern the exact bottom or tops of intermediate term moves - the 80% in between is more then sufficient for greatly magnified profits far above and beyond a buy and hold strategy.
However, it is not for the faint of heart. To buy into weakness and to sell into strength takes courage, conviction, and a contrarian nature. Buy and hold is best for most.
Let's take a look at some charts and see what they say. The first few will be fairly standard charts, and as we progress the charts will provide the methodology by which buying into weakness and selling into strength can be utilized. Please note that this week's report is not going to be a rehash of last week's action. Instead it is going to focus on the larger picture.
Hui vs. Gold
The first chart compares the performance of the Hui Gold Stock Index with physical gold. Physical gold is much safer and less volatile then gold stocks. However, gold stocks have an approximate 3 to 1 ratio of increased profits compared to physical gold.
As both the charts show - sometimes the Hui out performs, at other times physical gold out performs. When all is said and done at the end of a bull market in gold - the stocks out perform by about 3 to 1. Presently both charts show that the ratio is trending sideways or flat, suggesting that a break either to the upside or downside should be forthcoming.


Next up is a weekly chart of the Hui. It goes back to the beginning of the bull market in gold back in late 2000 - early 2001. A few points to look at on the chart.
Notice how far the price increased on each intermediate term move, and especially note how the 65 week moving average signaled all the big intermediate term moves. They would have been very hard trades - trades that would take nerves of steel - but they were by far the best buying opportunities the bull has of yet given. They required buying into weakness - when the blood was running in the streets as they say.

Secrets of the Gold/XAU Ratio
Now the good stuff. The next time the selling or price action in the pm's gets you down - just take a look at these charts to perk yourself back up.
First we have the chart of the gold/xau ratio. This compares the performance of gold to the xau index. The data on the chart is somewhat counter-intuitive and can take a while to sink in so that one feels comfortable with it. Some get it at first glance. It took me years.
The higher the number on the chart means that gold is out performing the xau. The lower the number - the xau is out performing gold. Simple enough.
Now note where the highest numbers are - those at 5 and above. Then follow the vertical lines down to their corresponding points on the xau chart below.
Every one of those high numbers is connected to an intermediate term low in the xau. If one had bought at each of these points, one would have done quite well.
Pretty easy - and pretty cool. The hard part comes in having the nerves and confidence to buy at such times. It's called the HARD TRADE. It's counter-intuitive and contrarian. It is not for the faint at heart.

The above chart emphasized readings of 5 or higher. Now we are going to look at a chart of readings of 4.75 and higher. The results hold up for this reading was well.
The trend may take a bit longer to unfold - but excellent gains are provided with patience.

All of the blue circled lows would have provided superb entry points in which to invest in the gold bull.
Next we have the same gold/xau chart but this time we are going to look to see if there are any clues as when to sell into strength during the intermediate term rallies.
Let's look at the chart.

This time follow the low readings of between 3 - 3.5 down the vertical blue lines and see where they intersect the xau price chart. Everyone of them hits an intermediate term peak or top that would have been ideal to sell at.
Once again, however, it's a hard trade that is counter-intuitive and goes against the grain of the herd instinct or what the majority of market players are doing. It is very contrarian - but very profitable as well.

Gold Chart Weekly
Below is the weekly gold chart. It shows the long term trend from the beginning of the golden bull to the present. Prices go from 252.50 to 730.40 - not an insignificant increase.
Notice the best time to buy was whenever the index fell and touched its 65 week moving average. Once again the hard trade - but the most profitable.

Next is a chart of gold from Kitco that goes back to 1979. Notice the symmetrical triangle that is marked, whose peaks are each declining in price.
Then note how the price action broke out from that level and went on to make new all time highs. It doesn't get much better then that.
![]()

Below is the present chart of gold as of Friday's close. Note the structure of the chart. Is has doubled in price from 250 to 500 and then corrected and doubled again to 730.00.
Now it has put in three declining peaks just as it did in 1979. It has also broken out and above its declining upper trend line.
Does this mean it is guaranteed that it is going to go on and double and make new highs? No it doesn't.
But is does show that it has occurred in the past, which means it can occur again in the future. Also, going on past trends and price action it actually has a fairly high probability of a repeat performance.

Central Fund of Canada
Next we have the chart of the central fund of Canada. Note the 65 day moving average again. It represents the best buying opportunities of the recent past.
There is a series of higher lows, a break out, and a positive MACD cross over. RSI has turned up as well. Not a bad looking chart.

Silver Wheaton
The last chart is the stock pick of the week: Silver Wheaton. Please note I own shares of this stock. Silver Wheaton does not actually produce or mine silver and other metals. It is a royalty company that buys and sells and invests in particular mines.
Its chart shows many positive divergences. It has put in a higher low. If these divergences are resolved to the upside, which since they are positive divergences is most likely, and if such action is coupled with a rising silver price - the profits could be quite interesting to say the least.

Summary
Interest keys will play a large part in the markets as the weeks ahead unfold. Depending on how the Fed and other banks respond to any rise in rates will be a large factor on how it all plays out. Remember, CB's can tinker with short term rates - but the market determines the long end of the yield curve.
In other words, the reaction of central banks to the actions of the market - can and do have as large or even larger effect then the original act or event. It is similar to the cure can be worse then the disease. First we could get deflation followed quite fast by hyperinflation.
The global game of currency devaluation is also a dominant factor, as interest rates have a large part in trying to "protect" continually debasing fiat currencies. Nation states need to attract money to buy their debt, especially the United States. Thus interest rates on the debt most be competitive with other issuers.
The consumer appears to be stretched out almost to the limit just to a make ends meet, let alone to accumulate true wealth without any debt. Debt loads are increasing yet household wealth is not.
Everyone may "have" a bunch of physical assets: cars, boats, McMansions - but who truly owns them and holds the title - the bank or them? Until you the loan or mortgage is paid off, all that is owned is debt.
And the poor bankers cry all the way to the bank and back home - sometimes your home that they foreclose on and collect - being the good collectivists that they are. Plus they get to keep all of the interest payments made on the mortgage to date. Nice system isn't it.
The Fed is walking the high wire act and only has itself to blame. One slip to either side will bring on the specter of deflation or hyperinflation, which we the consumer get to pay for - one way or the other.
Unreal estate would be clobbered by higher interest rates, which the central banks still hold sway over on the short end - at least for now. Such can change very rapidly, however. Once the bifurcation point is breached - chaos theory takes hold and plays out to the very end.
Oil and commodities appear to be putting in a bottom. Gold and silver have already made a bottom and should be breaking out to the upside in the near future.
Invitation
Stop by our website and check out the complete market wrap, which covers most major markets. There is also a lot of information on gold and silver, not only from an investment point of view, but from its position as being the mandated monetary system of our Constitution - Silver and Gold Coins as in Honest Weights and Measures.
There is also a live bulletin board where you can discuss the markets with people from around the world, as well as many other resources too numerous to list. Our gold stock portfolio where all trades in our own personal account is in the public domain for viewing is also available.
We put our money where our mouth is - right or wrong. We do not tell others how to spend their hard earned money. We simply publicly share how we invest ours. We have learned over the years that talk is cheap. Only the walk gets you anywhere different from where you are now. Drop by and check it out.
Good luck. Good trading. Good health. And that's a wrap.

Come visit our new website: Honest Money Gold & Silver Report
And read the Open Letter to Congress

COMING SOON: A REQUEST FOR AN AUDIT OF US GOLD RESERVES


