


Index Advisor 013
2/12/2007 8:07:32 AM
Recommended Trades:
Sell shares of IWM short with a limit of $80.60.
At this time, we intend to exit the trade at around $79.00 until it is apparent whether support will be broken. Set a stop at $81.25.
We had signals to short the DIAmonds and SPYders after Thursday's close. Depending on market action in the next two days, we may issue recommendations to enter these trades.
Open Positions:
Our long QQQQ position hit the stop at $43.90 and the trade was exited. We need to clear up some confusion, as our entry price recommendation was actually published at $43.85, not $43.90, so exiting at $43.90 actually resulted in a small profit as opposed to a neutral trade. We are sorry for any confusion this caused.
| Symbol | Position | Entry Price | Current Price | Dollar Gain/Loss | Percent Gain/Loss |
| DIA | Cash | ||||
| IWM | Cash | ||||
| QQQQ | Cash | ||||
| SPY | Cash |
Overview:
The previous weekly noted that the Fed policy statement noted that the economy was strengthening while inflationary pressures were subsiding. This allowed the markets to move up nicely on the day the policy statement was released. This last Wednesday, a Fed head began what became a concerted concern over inflation, and a clear possibility for the Fed to raise rates in response to signs that inflation doesn't continue moderating.
This process has taken awhile but both the equities and the bond markets appear to be concerned over when the Fed might raise rates, as opposed to when an easing might take place. Financial companies have been most effected by this and other concerns regarding mortgage loans. With that as a back drop, the focus continues to be on the strength of the economy and inflationary pressures. A day-by-day account of economic report releases follows:
Monday: The ISM Service report came in at 59.0 versus an expected 57.0. Last months reading was 56.7. Services are strengthening, even as last week's ISM Manufacturing number showed a contraction in manufacturing.
Tuesday: No economic reports released.
Wednesday: For the fourth quarter, the Labor Department reported non-farm productivity rose to a 3.0 percent annual rate, well above expectations of 2.0%. Unit labor costs grew by a lower-than-anticipated 1.7 percent. This eases the inflation outlook a bit, as the year-over-year gain dropped to 2.8%, from 2.9% in the prior quarter.
Philly Fed Reserve Bank President Charles Plosser, suggested that the current fed funds rate of 5.25 percent could be sufficient to keep inflation in check, but with the recently strengthening in the economy, this is "less likely." He even went so far as to suggest that "additional monetary policy action may be needed to keep us moving along the path to price stability."
Thursday: The weekly initial jobless claim number came in as expected at 311K (310K expected). Last week's number was revised to 308K from 307K. December wholesale inventories were expected to rise modestly, by 0.6%. Instead, they were reported to decline by 0.5%. Note, however that November's numbers were raised from -0.5% to 1.1%, so the inaccuracy may make the number somewhat meaningless.
HSBC holdings (NYSE:HBC), the world's third largest bank, indicated that reserves for bad-debt will be 20% higher than previously forecast. This pressured sub-prime lenders, the entire mortgage industry, and financials in general. Tol Brothers (NYSE:TOL), a leading luxury homebuilder, indicated Q1 orders dropped 33% and that full year write downs will "significantly exceed" forecasts. This contributed to more bearish concerns of a spillover of the housing market into the general market.
Friday: No economic reports released. However, Friday's concerted effort by Fed officials to jawbone investors into being concerned about inflation risk left the fixed income and stock markets reeling. There are a number of vacancies on the Fed, with both dovish and hawkish members leaving. This leaves investors wondering what tendencies replacements will bring to monetary policy going forward, with so many obviously leaning toward a tightening.
Three different Fed heads made speeches on Friday and all of them echoed a concerted theme began earlier in the week by Philly Fed President Charles Plosser. St. Louis Fed President Poole said inflation is still a concern; Cleveland Fed President Sandra Pianalto says the moderation in inflation is encouraging, but isn't yet convinced the trend is shifting down; Dallas Fed President Fisher has recently said he "wouldn't rule out" further rate increases and that he won't rest easier until core inflation is "well below 2%" on a sustained basis.
It is now obvious that the Fed wants the market to understand that there is more likelihood of a tightening than a loosening in the future. They are still concerned about inflation, and even though inflation most recently seems to be declining, the core rate is still above the 2% figure that the Fed is uncomfortable with.
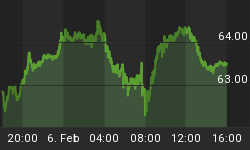
Oil rose eighty-seven cents on the week closing at $59.89. Friday saw trading as high as $61.00, a level we have identified as potential resistance. Natural gas also rallied about thirty-five cents to close at $7.827. Both energy products continue to find support above their uptrend lines, and oil is very close to breaking above the psychological barrier of sixty dollars. We believe a close above this level would lead to a challenge as high as sixty-four dollars in the near future. This would likely adversely affect stocks in the short term.
We believe the Fed is prepared to raise rates yet again if the markets don't react to their jawboning on inflation concerns. The bond market and stock market have been quite complacent about prospects for a raise in the Fed rate until recently. In fact, until recently, they were pricing in a lowering of the Fed rate in the first half of 2007. They still don't seem to have priced in the possibility of the Fed raising rates this year, and we think the Fed will continue jawboning the market until they do so, or they may actually raise rates.
To understand more about our view on the markets, we will have to look at the charts.
Market Climate
The market began the week moving up but lost all those gains on Friday as worries of Fed rate hikes took their toll.
The market underwent further accumulation last week until Friday when there were signs of widespread distribution. One day doesn't make a trend but it is worthwhile to monitor accumulation or distribution for a divergent move to the market as it is an early warning sign that things are out of sync. At this time, there is a correlation to the price movement of the stock market and the signs of accumulation and distribution.
The U.S. stock market composite chart:

Friday's move lower seems significant, even though it wasn't a particularly large move. In fact, the daily trading lows from a week ago Friday, Monday, Tuesday and this past Friday define a support area that we believe will be broken shortly. This will signal the beginning of a new move downward for the markets, that may turn into the oft forecasted 10% correction.
The important things to note are the indicators we regularly monitor in relation to price. Note that RSI rose through the week, as did MACD as well as trading volume. The MACD histogram fell through the week. Friday, RSI and MACD abruptly reversed course, mimicking price. Volume actually continued to increase.
The last time the chart looked somewhat similar was around the Thanksgiving holiday. The market closed on the holiday shortened Friday, November 24th. Monday saw a large move downward on average volume, followed by three days of accumulation which put the market higher than the close the previous week. The difference in trading volume is significant as this Friday's volume is the highest since mid June 2006, which marked the initial bottoming of the market (recall that the market formed a double bottom a month later).
What does it mean? We believe that the market is getting ready to make a move lower. This will be confirmed by the MACD 12-day moving average crossing over its 26-day moving average. You will note when that occurred in mid-December, the market moved lower until early/mid January, even though this is the traditional Santa Claus rally period.
Now, let's take a look at the charts for the major indexes.
A look at the weekly chart for the Dow Industrials is represented by the Diamonds ETF (Amex:DIA).

Abbreviations and color key appears below:
Note the following order is Red, Yellow, Green, just like a stop light, so it might be a helpful mnemonic:
Thick Red line represents the 200-day simple Moving Average, (200DMA)
The yellow line represents the 50-day simple Moving Average, (50DMA)
The green line represents the 20-day simple Moving Average, (20DMA)
The light blue line represents the 3-day Moving Average, moved forward three days in time, (3x3MA)
The thick blue line indicates the exponential 13-day Moving Average (13DMA)
Bollinger Bands are abbreviated as BB. There is an upper and a lower Bollinger Band that varies in distance from a central moving average (shown as light red/pink) based on the volatility of stock price movements.
RSI stands for Relative Strength Index. It is an oscillator, which can be used to determine how overbought or oversold a stock may be.
The weekly chart suggests the trend hasn't yet been broken, but an advance may be difficult at this time. During the last eight months, Hirami patterns haven't been confirmed with one exception. Let's take a look at the daily chart to see what it reveals.
A look at the daily chart for the Dow Industrials is represented by the Diamonds ETF (Amex:DIA).

The DIAmonds appear to have run into trouble, but nothing particularly serious. Friday's loss was only $0.59 or about one half of one percent. They continue to hold above the intermediate term uptrend line and above even the 20-day moving average. The 50-day moving average hasn't been tested, let alone closed below since it crossed above that average on July 25th, 2006. That is a very long time to go without that important average being tested and signifies the strength of this uptrend.
While there was a signal to short the DIAmonds after Thursday's close, staying short the DIAmonds for any length of time after one of these signals in the last eight months was a certain way to be on the losing end of the trade. We would not be confident in shorting the DIAmonds aggressively until the 50-day moving average is decisively broken.
The S&P 500 ETF, known as the Spyders (AMEX:SPY) is shown in the weekly chart below:

The weekly chart suggests the SPYders may trade sideways for a bit or even reverse into a downtrend move. We wouldn't get too excited at downside prospects until the support line on the chart is clearly broken. Last week we suggested the SPYders would see consolidation, which is what has occurred. We also suggested last week that support may be found just below the $44.00 level, which is where we closed on Friday ($143.96). If this holds then we would expect the advance to resume again after a consolidation period. A dip down to around $143.25 might find support as well (see chart).
The Fractal Indicator isn't indicating a strongly trending state at this time.
The S&P 500 ETF, known as the Spyders (AMEX:SPY) is shown in the daily chart below:

As indicated in the discussion of the weekly chart, the daily chart shows the uptrend is still unbroken. Friday's test to the 20-day moving average was rejected so we need to watch trading action in the coming week to see if any sort of real down trending action can get underway.
This week's NASDAQ 100 ETF (QQQQ) Weekly and Daily Charts are below:


Examining the weekly and daily charts, we see the potential for a large move exists, with the weekly Fractal Indicator now in position for the start of a strongly trending move. The 20-week (100-day) moving average lies just below and if broken would present the first such opportunity for the bears to get some real downside action started. Thus far, the $43 area hasn't been seen since late December. In addition, the 100% Fibonacci retracement level exists around $43.55, so it will have to be breached before further downside action will get started.
This week's Russell-2000 ETF (Amex:IWM) Weekly and Daily Charts are below:

The Hirami star pattern is not common and is generally a potent reversal sign. The Russell-2000 has been leading the latest market advance as investors and traders rush to add more volatility (risk) to their portfolios. This often occurs at market tops, and we are wary about this latest strong move upward.

The daily chart suggests that the downtrend may now be exhausted (the Fractal indicator turned upward). The support of the 20-day moving average lies more than one dollar below just above the $79 level. Friday's large red candle confirms Thursday's Hirami indicating a braking of the uptrend.
We believe that a short entry at around $80.60 could be safely exited around $79.00 for a short term short trade until it become apparent whether support will be broken.
Conclusion:
The Fed heads seem to be stepping up to a concerted effort to jawbone the markets to consider an interest rate hike and are getting the desired reaction (for a day anyway). If the markets remain convinced the Fed is serious about the possibility to raise rates, the market will likely become defensive here and perhaps even begin a sell-off. A sign of core inflation creeping up, with say a monthly report of core CPI reaching 0.3% would likely send the markets into a tailspin, as the Fed is likely to act on that sort of data. The Fed's favorite inflation gauge is the chain deflator, which has been looking somewhat benign of late. We will continue to monitor these reports to position for profitable trading.
Growth prospects for 2007 appear to be dropping down into single digits, at least for the first half of the year or more. This has already been seen in guidance provided by many companies and some warnings issued, such as Micron's warning of a semiconductor glut of memory chips.
We believe that growth will continue, albeit more slowly and that investors will weigh the risk of equities versus the returns of fixed equities going forward. With Fed rate hikes in the picture, it makes bonds less desirable as their value diminishes with rising rates. Still, if company earnings growth drops down toward the rates paid by fixed income, investors may flee equities for less risk. This represents quite a conundrum for investors in U.S. securities going forward, and we shall continue to provide analysis to position for profits going forward.
Regards and Good Trading,


