


Index Advisor 016
2/26/2007 7:51:07 AM
Recommended Trades:
There are no trade recommendations at this time.
Open Positions:
In general, once we have entered a position, we will issue an alert to exit the position. We will note likely target areas for a trade, but we buy and sell on signals, rather than target areas. The same method applies to stops, as we don't use classical stops, but rather rely on the signals generated to reverse or exit our positions.
Symbol | Position | Entry | Current | Dollar | Percent |
DIA | Short | $127.41 | $126.41 | $ 1.00 | 0.1% |
IWM | Short | $ 80.60 | $ 81.66 | $-1.06 | -1.3% |
QQQQ | Short | $ 44.65 | $ 45.26 | $- .61 | -1.4% |
SPY | Short | $145.44 | $145.30 | $ 0.14 | 0.1% |
Overview:
In this past holiday shortened week, earnings reports have clearly taken a back seat to worrying about whether the Fed may raise interest rates. Economic reports continue to show a slowing economy while inflation, which had appeared to be easing modestly, shows signs that it is threatening to reverse course. Of course, this has been a theme in focus even through the earnings reporting season for the quarter ended Dec 2006.
Once again, the recurring theme from the bulls is that the weak housing market will keep the Fed from raising rates in the face of higher inflation. Last week, the bulls suggested the Fed would lower rates. There was a time when the bulls claimed that the housing markets set backs wouldn't affect the overall economy, and could therefore be dismissed. That theme has migrated but a bullish message is maintained.
Let's take a look at the week in review:
Monday: The market was closed.
Tuesday: There were no economic reports released on Tuesday.
Wednesday: The Consumer Price index was reported at 8:30am EST with a rise of 0.2% (versus an expected 0.1%) for January. Core CPI was reported at 0.3%. This is higher than the expected 0.1% and caused weakness at the open. In addition, at 10:00am, the leading index indicator was reported with a rise of 0.1% versus an expected 0.2% rise. The FOMC minutes were also released at 2:00pm EST and really didn't have an effect on the market.
Thursday: Jobless claims were reported at 332K versus an expected 325K. The prior week's 357K was revised upward to 359K. While this number can be volatile, the last two reports have broken above the range of the last six months and lifted the four week average to an area where some softening in the jobs market may be indicated.
Friday: There were no economic reports released Friday.
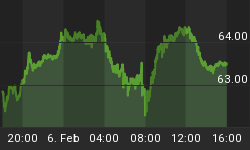
Oil fell rose nearly two dollars during the week and moved solidly above the sixty dollar range, to our first identified resistance level of $61, closing at $61.14. The next resistance level above lies at $64. Natural gas rose by twenty-five cents to close at $7.755. Both energy products continue to find support above their uptrend lines.
By the end of a quiet news week, the focus was on concerns about the Sub-prime lenders and a spread to other financial industries. The worries over the hit this is causing on the overall economy are actually being used by the bulls as an argument that the Fed won't raise rates, even in the face of rising inflation.
In addition to this, the UN had set a two month period for Iran to stop moving forward with their nuclear program. That deadline came and went, and it appears that Iran is not only moving its program forward, it is accelerating its efforts. On Saturday, after this week's market close, a report of Iran's sending a rocket some 94 miles above the earth circulated and was confirmed by numerous officials in Iran, including cooperation from the defense ministry. Iran has announced their intent to improve on existing missiles with a range of 1,250 miles. U.S. Vice President Cheney stated that all options were on the table to deal with Iran, meaning the military options may be considered.
All of this rattled traders last week, and we could see continued worries cause more defensive posturing by market participants. At the same time, we saw adoption of more risk by other participants. Which of them will be correct could become clear as early as Monday.
It has been a lot of time since geopolitical risk has affected the markets. This may be the necessary catalyst to start the markets toward a long expected correction. For that matter, the markets may continue to overlook risk and the markets may continue the uptrend that began last summer. We will have to wait for Monday to sort through all of that.
Stepping back from the fray, the market continues to exhibit a bullish undertone, in the face of a slowing economy. Part of that may be due to valuation of the Dow, the markets largest companies. The Dow companies, as a whole, are significantly undervalued compared to the rest of the market. Perhaps as much as 50% undervalued. That alone provides impetus to continue to bid the market up. However, that valuation doesn't apply broadly to the rest of the market, which is trading much closer to its value. The Dow may continue to provide the engine that drives this market upward. Until we see something meaningful that finally shakes the confidence of investors, the market is likely to continue to move higher. When that will occur is not predictable.
To understand more about our view on the markets, we will have to look at the charts.
Market Climate
The market began the week with a continuation of its move higher from the previous week. The Dow Jones Industrial Average (DJIA) deviated from the rest of the market on Wednesday and began moving downward, closing down consecutively each day of the week. The small caps and the NASDAQ soared even as the DJIA fell. Only late in the week did the major indexes move downward together.
Volume across the various exchanges has been somewhat steady, but a bit lighter than normal. The market seems confused and is looking for a catalyst to help it move higher or lower. With the small caps and NASDAQ moving upward, it may be that the adoption of risk will mark the end of this uptrend.
Let's examine implied volatility, as measured by the VIX and the VXN, in terms of what they predict for market movement, and the adoption of risk.
The S&P-500 implied volatility is tracked by the VIX (INDEX:VIX)

Examining the chart we see that as the VIX once again reached down to the 10 level, it reversed higher as the S&P-500 began to sell off. If the current pattern holds, the VIX will once again turn downward from around the 11 level and the S&P-500 will again move higher. We would suggest that if the VIX rises markedly above that level, then the S&P-500 will test down to at least its bottom uptrend line, and possibly farther. It is clear that the VIX can not continue to bounce much longer between the 10 level and the 11 level, as the wedge will close out by April. We would expect a dramatic move before then.
The NASDAQ-100 implied volatility is tracked by the VXN (INDEX:VXN)

Looking at the chart of the VXN, we see a coiled spring. The VXN is at a critical juncture suggesting the NASDAQ-100 will explode upward or downward shortly. We could see the NASDAQ-100 moving lower to retest the uptrend line. Conversely, we could see the NASDAQ-100 break out and the VXN the 14 level or perhaps even lower. Monday is a critical day when the market will tip its hand.
Finally, we note that the put/call ratio for the index funds leapt up to 3.82 on Friday. This is a level that hasn't been seen since December of 2005, and not for several years before that. It represents a lot of "insurance" being bought for potential downside risk.
Now, let's take a look at the charts for the major indexes.
A look at the weekly chart for the Dow Industrials is represented by the Diamonds ETF (Amex:DIA).

Abbreviations and color key appears below:
Note the following order is Red, Yellow, Green, just like a stop light, so it might be a helpful mnemonic:
Thick Red line represents the 200-day simple Moving Average, (200DMA)
The yellow line represents the 50-day simple Moving Average, (50DMA)
The green line represents the 20-day simple Moving Average, (20DMA)
The light blue line represents the 3-day Moving Average, moved forward three days in time, (3x3MA)
The thick blue line indicates the exponential 13-day Moving Average (13DMA)
Bollinger Bands are abbreviated as BB. There is an upper and a lower Bollinger Band that varies in distance from a central moving average (shown as light red/pink) based on the volatility of stock price movements.
RSI stands for Relative Strength Index. It is an oscillator, which can be used to determine how overbought or oversold a stock may be.
This chart shows more of the same. The pattern has been a long white candle one week and then a shallow pull back the next week, never breaking the uptrend line started last summer. Until we see a difference in the pattern, we would expect it to continue.
A look at the daily chart for the Dow Industrials is represented by the Diamonds ETF (Amex:DIA).

The daily chart confirms in more detail, what the weekly chart has already illustrated. Even though short term uptrends may get violated, this has always resulted in an immediate rally. We would suggest that such a rally will take place early in the week, if this pattern continues to hold. A marked move down to test the 50-day moving average would change this pattern, but we won't predict that to occur, but rather observe it and use it as a gauge to note that trading behavior will have changed.
The S&P 500 ETF, known as the Spyders (AMEX:SPY) is shown in the weekly chart below:

The SPYders are now teasing us with a Hirami pattern. You will recall that a Hirami pattern suggests a braking of the uptrend, but requires confirmation. It is more meaningful late in a trend (that condition is satisfied) but has provided many false signals since this uptrend began last summer. We would suggest that until the short term uptrend line is violated, that the uptrend will resume.
The S&P 500 ETF, known as the Spyders (AMEX:SPY) is shown in the daily chart below:

The daily chart confirms that the latest weakness in the SPYders hasn't yet been meaningful. The 20-day moving average hasn't yet been tested, let alone 50-day moving average. Once again, until we see a more significant move lower, we have to believe the uptrend will continue.
This week's NASDAQ 100 ETF (QQQQ) Weekly and Daily Charts are below:

The weekly QQQQs suggest a meaningful move may be just getting started. The QQQQs have just challenged resistance and fell back slightly. A break above resistance early this week puts the QQQQs in six-year high territory with no resistance above.

The chart for the daily QQQQs suggests that Monday will be an important day. Strong follow-through to the upside will leave the QQQQs at a six year high and above resistance. A collapse here would mean a break of the steep short term uptrend line and another test of the intermediate term uptrend line.
We note that price has moved up significantly faster than accumulation. This means that the rally has been on lighter volume and is an important divergence to monitor. Still, we note that accumulation has been strong for the last two weeks having only turned down slightly on Friday. Of course, this accumulation started at a low level, after a move down in the market since early January. If there are immediate signs of continued accumulation, then the bears will have to limp away to lick their wounds, waiting for an event that can act as a catalyst to derail this bull market. If there is a significant downward move immediately, then the market would be vulnerable, as we have indicated and we would monitor for an alignment or divergence with accumulation or distribution.
This week's Russell 2000 ETF (Amex:IWM) Weekly and Daily Charts are below:

The weekly chart of the IWMs shows an unbroken uptrend since the summer. Last week, this move was confirmed, and the Fractal indicator (not shown) suggest a new strong trending move is underway.

The chart for the daily IWMs shows Friday's correction wasn't yet meaningful. There was potential to indicate a top, but the pattern wasn't quite there. Still, of all the indexes we regularly track here, the Russell-2000 looks the most vulnerable to a continued pull-back here.
Conclusion:
Once again, we maintain a cautious stance with the uptrend long in the tooth. However, it seems like the uptrend pattern continues to repeat itself and no major support has been breached. With the noted weakness in the Dow, and the DIAmonds trading back to test their 20-day moving average, there are no other signs of significant weakness in any of the indexes. In fact, the NASDAQ-100 looks set to break out. The immediate success or failure of such a move is likely to affect the direction the markets will take, at least for the next week or two.
Geopolitical risk is growing, and the market seems to be ignoring it for the most part. Other than a rise in the price of oil, it is hard to detect any concern in the way the investors are behaving. It is as if Iran's defiance of the UN is of no concern. Perhaps the sub-orbital test of a new rocket will have the markets take note, but we aren't certain that this is a sufficient catalyst.
The price of oil is now at the $61 resistance area. If oil moves up to test resistance at $64, this may cause some concern in the markets. If oil breaks through the $64 level, then we believe this may be a sufficient catalyst to finally reverse the uptrend started last summer. Until then, we have to monitor market action and continue to believe in the trending pattern until it is broken.
Housing is still a significant concern. On a slow news day, the market focused on sub-prime lenders, and the financial sector is being hurt broadly with overall concerns of the narrow spread between short and long term interest rates. The market will continue to focus on the Fed, the price of oil, and perhaps geopolitical events until some catalyst provides a reason to take profits.
Regards and Good Trading,


