


Weekly Trader Alert #93
2/26/2007 9:47:10 AM
Overview
In this past holiday shortened week, earnings reports have clearly taken a back seat to worrying about whether the Fed may raise interest rates. Economic reports continue to show a slowing economy while inflation, which had appeared to be easing modestly, shows signs that it is threatening to reverse course. Of course, this has been a theme in focus even through the earnings reporting season for the quarter ended Dec 2006.
Once again, the recurring theme from the bulls is that the weak housing market will keep the Fed from raising rates in the face of higher inflation. Last week, the bulls suggested the Fed would lower rates. There was a time when the bulls claimed that the housing markets set backs wouldn't affect the overall economy, and could therefore be dismissed. That theme has migrated but a bullish message is maintained.
Let's take a look at the week in review:
Monday: The market was closed.
Tuesday: There were no economic reports released on Tuesday.
Wednesday: The Consumer Price index was reported at 8:30am EST with a rise of 0.2% (versus an expected 0.1%) for January. Core CPI was reported at 0.3%. This is higher than the expected 0.1% and caused weakness at the open. In addition, at 10:00am, the leading index indicator was reported with a rise of 0.1% versus an expected 0.2% rise. The FOMC minutes were also released at 2:00pm EST and really didn't have an effect on the market.
Thursday: Jobless claims were reported at 332K versus an expected 325K. The prior week's 357K was revised upward to 359K. While this number can be volatile, the last two reports have broken above the range of the last six months and lifted the four week average to an area where some softening in the jobs market may be indicated.
Friday: There were no economic reports released Friday.
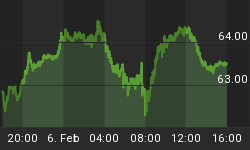
Oil fell rose nearly two dollars during the week and moved solidly above the sixty dollar range, to our first identified resistance level of $61, closing at $61.14. The next resistance level above lies at $64. Natural gas rose by twenty-five cents to close at $7.755. Both energy products continue to find support above their uptrend lines.
By the end of a quiet news week, the focus was on concerns about the Sub-prime lenders and a spread to other financial industries. The worries over the hit this is causing on the overall economy are actually being used by the bulls as an argument that the Fed won't raise rates, even in the face of rising inflation.
In addition to this, the UN had set a two month period for Iran to stop moving forward with their nuclear program. That deadline came and went, and it appears that Iran is not only moving its program forward, it is accelerating its efforts. On Saturday, after this week's market close, a report of Iran's sending a rocket some 94 miles above the earth circulated and was confirmed by numerous officials in Iran, including cooperation from the defense ministry. Iran has announced their intent to improve on existing missiles with a range of 1,250 miles. U.S. Vice President Cheney stated that all options were on the table to deal with Iran, meaning the military options may be considered.
All of this rattled traders last week, and we could see continued worries cause more defensive posturing by market participants. At the same time, we saw adoption of more risk by other participants. Which of them will be correct could become clear as early as Monday.
It has been a lot of time since geopolitical risk has affected the markets. This may be the necessary catalyst to start the markets toward a long expected correction. For that matter, the markets may continue to overlook risk and the markets may continue the uptrend that began last summer. We will have to wait for Monday to sort through all of that.
Stepping back from the fray, the market continues to exhibit a bullish undertone, in the face of a slowing economy. Part of that may be due to valuation of the Dow, the markets largest companies. The Dow companies, as a whole, are significantly undervalued compared to the rest of the market. Perhaps as much as 50% undervalued. That alone provides impetus to continue to bid the market up. However, that valuation doesn't apply broadly to the rest of the market, which is trading much closer to its value. The Dow may continue to provide the engine that drives this market upward. Until we see something meaningful that finally shakes the confidence of investors, the market is likely to continue to move higher. When that will occur is not predictable.
To understand more about our view on the markets, we will have to look at the charts.
Market Climate
The market began the week with a continuation of its move higher from the previous week. The Dow Jones Industrial Average (DJIA) deviated from the rest of the market on Wednesday and began moving downward, closing down consecutively each day of the week. The small caps and the NASDAQ soared even as the DJIA fell. Only late in the week did the major indexes move downward together.
Volume across the various exchanges has been somewhat steady, but a bit lighter than normal. The market seems confused and is looking for a catalyst to help it move higher or lower. With the small caps and NASDAQ moving upward, it may be that the adoption of risk will mark the end of this uptrend.
The U.S. stock market composite chart:

The US Composite managed to put three days of gains together on constant volume through the week. Friday finally saw some distribution across the market but it wasn't really very much. RSI has been weakening, while MACD peaked on Thursday and its histogram continues to head toward negative territory.
Last week we suggested the market would have trouble moving upward and a consolidation or the beginning of a downward move were likely. Even though we saw the broad market move higher last week, the Dow moved down, as did the S&P-500, while the NASDAQ (powered primarily by the semiconductors) and especially the Russell-2000 moved higher until Friday.
We now believe that as Monday goes the market is likely to follow. If the market moves broadly lower, we believe it will be the beginning of a more significant move. However, there are many signs that the market could break upward here, with leadership from the NASDAQ, and in particular, from the semiconductors.
Before we move on to other fundamental trends, let's examine the semiconductor index, as it is often a significant influence on where the NASDAQ will go.
The weekly chart of the semiconductor index (INDEX:SOX) is below:

Looking at the weekly chart of the semiconductor index, it is pretty clear that the overall bullish action in the market since last summer peaked in November for the semiconductors. This explains the trouble the tech heavy NASDAQ has had in gaining traction. This last week clearly broke up through the resistance of the downtrend line of the symmetrical triangle. The next week is critical as the SOX challenges the level where the SOX stalled in late November / early December last year.
The daily chart of the semiconductor index (INDEX:SOX) is below:

This chart shows how close the SOX has come to testing resistance. In addition, it shows the possible emergence of a very bearish candlestick pattern. This is a "what if" scenario, not a foregone conclusion. However, we would be willing to short semiconductor stocks if the candle for the SOX on Monday is a large red one. This would confirm an evening star at resistance, which is a high probability trade. The only question is which stock would present the best shorting opportunity.
On the other hand, if the SOX break through resistance, then we could see a real tech rally get underway, with the NASDAQ continuing the advance that began in earnest last week.
Fundamental Trends
There are no builders in the top five industries, but the top screen still has five building industries. The mining/Construction machinery industry has been replaced by farm machinery, although it is still in the top screen. The steel trade is still on with alloy makers in the top five and the basic steel makers in the top forty industries.
The Dairy and Meat industries are in ninth and tenth place, not far off screen. The rest hasn't changed that much.
The only Auto and Truck industry remaining in the top screen is the tire industry.
The US Integrated Oil industry remains in the top screen in 18th place with machinery suppliers to the oil industry in 20th place.
The Industry leaders (ranked 1st-5th out of 190) are:
Leaders 2-23-2007 | Leaders 2-16-2007 | Leaders 2-09-2007 |
Chemical (Fertilizers) | Food (Dairy Products) | Auto & Truck (Repl Parts) |
Personal (Funeral Svcs) | Chemical (Fertilizers) | Container (Metal/Glass) |
Machinery (Farm) | Food (Meat) | Food (Meat) |
Steel (Alloy) | Machinery (Const/Mining) | Retail (Department Stores) |
Container (Metal/Glass) | Container (Metal/Glass) | Machinery (Automation) |
Only the Canadian oil producers are in the cellar dwellers now. Tobacco is now in the bottom five. The tobacco industry is typically one of the high flyers, so there must be further litigation risk, but we need to investigate this. Consumer electronics entered the cellar dwellers which is unusual. Finally, mortgage services reappeared in the cellar dwellers as a big concern as there are rumors of a number of subprime lenders having to declare bankruptcy.
The most notable change is that residential construction has once again made it into the cellar dwellers. Perhaps there was false optimism that the housing market had hit a bottom. That certainly was the topic of discussion on Friday.
The Industry laggards (ranked 186th-190th out of 190) are:
Laggards 2-23-2007 | Laggards 2-16-2007 | Laggards 2-09-2007 |
Personal (Tobacco) | Petroleum (Cdn Expl/Prod) | Petroleum (Intl Specialty) |
Building (Resid't/Com'l) | Petroleum (Drilling) | Financial (Mortgage Svcs) |
Retail (Consumer Electronics) | Chemical (Plastics) | Instruments (Control) |
Petroleum (Cdn Expl/Prod) | Petroleum (Intl Specialty) | Petroleum (Cdn Expl/Prod) |
Financial (Mortgage Svcs) | Instruments (Control) | Chemical (Plastics) |
Trade Recommendations
We continue to monitor BPT and ROG for entries. We believe ROG will consolidate here and are hopeful for a better price for BPT, as we missed the bottom. The idea is the bottom may get retested and we can get a better entry price for it.
We continue to monitor RDY and have some other picks as well. However, it is important to watch the semiconductor stocks today as they are the canary in the coal mine to determine near term market direction. We will delay jumping on board, at least until later today.
Current Portfolio
FDG closed the week at $23.96, up nearly one dollar. It held the $23.00 level that we have been discussing. It is now making its way up toward a challenge of its 200-day moving average in the low $26.00 range. We are still awaiting the dividend payment, expected in March. We are long FDG.
* Initial stop prices are set to cause us to exit our positions if they close below these levels. You will note they are generally kept pretty tightly the opposite side of the trades we initiate. Historic volatility would imply that intraday price action may trade outside of these values, so that condition is insufficient to cause an exit from an existing position. On significant movement beyond our stop prices, we may issue an intraday message to exit the position or to maintain the position. You may chose to implement an absolute stop below these suggested stop values, but that stop should be wide enough to take care of the daily volatility for the stock in question. You can examine the candlesticks for an idea of intraday price fluctuations.
Entry prices are adjusted to account for dividends paid. The stock price was adjusted by your broker, to reflect the dividend taken out. The non-adjusted entry price reflects the actual entry price, without the adjustment for dividend values.
LVPB Concept: The concept is a Light Volume Pull Back, where a stock's price will pull back to a support level on light volume. Obviously, heavy selling is a sign of weakness, and we would not want to buy on a heavy volume pullback. However, we will occasionally place stocks on the LVPB (Light Volume Pullback List) to indicate a "re-entry" buying opportunity, when we have already entered a position. This should be used to add to existing positions, or to enter a position if you missed the initial entry.
LVPB Portfolio Stocks:
Conclusions
Once again, we maintain a cautious stance with the uptrend long in the tooth. However, it seems like the uptrend pattern continues to repeat itself and no major support has been breached. With the noted weakness in the Dow, and the DIAmonds trading back to test their 20-day moving average, there are no other signs of significant weakness in any of the indexes. In fact, the NASDAQ-100 looks set to break out. The immediate success or failure of such a move is likely to affect the direction the markets will take, at least for the next week or two.
Geopolitical risk is growing, and the market seems to be ignoring it for the most part. Other than a rise in the price of oil, it is hard to detect any concern in the way the investors are behaving. It is as if Iran's defiance of the UN is of no concern. Perhaps the sub-orbital test of a new rocket will have the markets take note, but we aren't certain that this is a sufficient catalyst.
The price of oil is now at the $61 resistance area. If oil moves up to test resistance at $64, this may cause some concern in the markets. If oil breaks through the $64 level, then we believe this may be a sufficient catalyst to finally reverse the uptrend started last summer. Until then, we have to monitor market action and continue to believe in the trending pattern until it is broken.
Housing is still a significant concern. On a slow news day, the market focused on sub-prime lenders, and the financial sector is being hurt broadly with overall concerns of the narrow spread between short and long term interest rates. The market will continue to focus on the Fed, the price of oil, and perhaps geopolitical events until some catalyst provides a reason to take profits.
For those of you who have enjoyed your subscriptions to the Fundamental Trader and who would like to get additional savings off the price of your subscription, you may consider an annual subscription to the service. You can save nearly 20% off of the monthly rate by selecting the annual subscription price. Just click on the link below:
http://www.stockbarometer.com/pagesMFT/learnmore.aspx.
Regards and Good Trading,


