


Index Advisor 020
3/12/2007 9:05:27 AM
Recommended Trades:
Last Tuesday, we exited our short positions with a cumulative profit of more than 16%. We have been waiting for a test upward of the 100-day moving averages. We are at that test. Should the test fail, we will enter short positions once again. Until then, we wait and may enter long positions.
Open Positions:
In general, once we have entered a position, we will issue an alert to exit the position. We will note likely target areas for a trade, but we buy and sell on signals, rather than target areas. The same method applies to stops, as we don't use classical stops, but rather rely on the signals generated to reverse or exit our positions.
Symbol | Position | Entry | Current | Dollar | Percent |
DIA | Cash | $ | $ | $ | % |
IWM | Cash | $ | $ | $ | % |
QQQQ | Cash | $ | $ | $ | % |
SPY | Cash | $ | $ | $ | % |
Overview:
Last week's market action can be viewed as relief. The Asian markets have been able to move higher, and, as if shadowing these markets, so too have the US markets.
In reality, the market had been waiting for a catalyst to sell-off, and it was only a matter of when and how far the sell-off would go.
Implied volatility, as measured by the VIX and VXN has eased. Examining both those charts below we see that both have touched levels where bottoms have been put in over the last several years.

The VIX clearly rose to a level that has market bottoms in recent years. Since late 2003, the VIX rose up to the level around 19 and when it reversed lower, it proved a reliable indicator of a market bottom. Note, however, that the the VIX was also bottoming anywhere from 14 to 16 so the jump up to the 19 area was proportionally less than the jump from 10 to 19 two weeks ago. The move back down to 14 shows that implied volatility has retreated significantly as the market seems once again a tendency toward complacency.
Will this mark a bottom for the S&P-500? In the past, rallies out of VIX marked bottoms have lasted as little as two weeks. Examples of failed bottoms with lower bottoms that followed are 2004s March, May, August bottoms, and 2006's April, May, June bottoms.

The VXN rose above a level that has marked bottoms in the recent past. However, the absolute level is for a weekly close below 24 a week ago, while in 2004, the VXN would reach levels of 29. This has to be seen in perspective that in 2004, the VXN never closed below 19 on a weekly basis, and was mostly above 22.
Will this mark a bottom for the NASDAQ-100? We see a similar story as for the S&P-500, where when a bottom is indicated, it may be followed by another lower bottom, or a double bottom retesting old levels.
We wouldn't rule out a retest lower for either the S&P-500 or the NASDAQ-100. It is important to watch the trading action in the upcoming week to determine if we will have an imminent retest on a failure at resistance, or whether the indexes will attempt to reach the level of their recent highs.
Before we go deeper into what the rest of the week held, let's review economic reports released during the week.
Monday: There were no economic reports released on Monday.
Tuesday: Economic reports were negative and ignored by investors.
- Productivity was revised down from 3.0% to 1.6%, versus an expected 1.7%
- Factory orders for January declined 5.6% versus an expected 4.0% drop.
- Labor costs were revised from 1.7% to an unexpected 6.6% for the fourth quarter. This represents an increase of 3.2% for the year, the highest rate since 2000.
Several things combined to provide a relief rally for stocks: The dollar rose in relation to the Yen, the Asian markets rallied, and the U.S. market was clearly oversold. In addition, former Fed Chairman, Alan Greenspan restated his recession prediction for later this year as a 1 in 3 chance.
Wednesday: The Fed's beige book was released today showing modest growth in many regions but some regions showed slowing. Consumer credit rose $6.4B, versus an expected $7.0B, most of it related to auto loans.
Thursday: The only economic report released was the initial unemployment claims number for last week, which was reported at 328K versus an expected 335K, down 10K from last week's 338K. The US equities markets appear to be closely following trading in Asian markets, so an up day there on Thursday led to a gap up opening in US markets.
Friday: An hour before the open, the jobs report came out and reported 97K jobs were added in February, while the previous two months of data were revised upward to show gains of an additional 55K jobs. In addition, Fed Governor Bies suggested the sub-prime lending problem may be just starting. In a related matter, New Century Financial (the second largest independent sub-prime lender) stopped accepting applications for new loans in what may be the precursor to a bankruptcy filing. Hovnanian (a large home builder) reported a Q1 loss and took down guidance for 2007. This renewed fears over the homebuilding sector.
The Yen carry trade seems to have moved out of fear territory into a "something to be monitored" category. The concern about the Yen carry trade all being unwound simultaneously hasn't yet played out. With a number of funds still in this trade, it could still happen, and certainly there is pressure to unwind the trade by next August, which corresponds with the warning sent by the Bank of Japan.
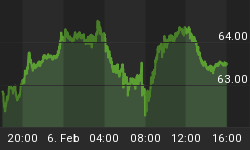
Oil traded in a range of sixty to sixty-two dollars for the week, closing at$60.05. This was a clear break of the uptrend line, and support of the 100-day and 50-day moving averages lies below at the $59 and $58 levels respectively. Above, resistance is at $64. Natural gas dropped another sixteen cents from last week in anticipation of warm weather in the coming week. Natural gas is now on the brink of support at the seven dollar level.
The bullish argument continues to be that the Fed won't be able to raise rates in the face of a slowing economy. The unemployment number on Friday came in at 97K, just 3K less than the expected 100K jobs, which indicates the economy continues to add jobs. Job creation for the previous two months was also revised upward by 55K. Perhaps most importantly, hourly earnings rose by 0.4% last week, placing the average year over year growth in earnings around 4.1 percent. This is worrisome to the Fed who have expressed concern over wage-induced inflation, especially in light of inflation, as measured by CPI, is only up around 2.1% during the same period.
The noted increase in delinquencies in the sub-prime mortgage market is of concern. The fact that New Century (NYSE:NEW) has stopped accepting applications for new loans suggests that they may be headed for bankruptcy. Given that they are they second largest independent sub-prime lender, it is a manifestation of the trouble that industry is experiencing, having extended loans to the riskiest borrowers in the face of a weak housing market where housing prices in many areas have been in decline.
The concern in the market is whether the problems of the sub-prime lenders can be contained or whether it will extend to other parts of the economy. It appears that other parts of the mortgage industry aren't experiencing these problems yet.
To understand more about our view on the markets, we will have to look at the charts.
Market Climate
The market began the week with a continuation of its move lower at the end of last the prior week. The common saying in the markets is that weak Fridays lead to weak Mondays.
On Tuesday, the market rallied and it appears an initial bottom was put in. US Equities markets have rallied from outside of the lower Bollinger Bands to challenge resistance at important moving averages. Overall volume during last week's rally has been consistently lighter than the volumes on the large downside moves the week before.
A look at the daily chart for the Dow Industrials is represented by the Diamonds ETF (Amex:DIA).

Abbreviations and color key appears below:
Note the following order is Red, Yellow, Green, just like a stop light, so it might be a helpful mnemonic:
Thick Red line represents the 200-day simple Moving Average, (200DMA)
The yellow line represents the 50-day simple Moving Average, (50DMA)
The green line represents the 20-day simple Moving Average, (20DMA)
The light blue line represents the 3-day Moving Average, moved forward three days in time, (3x3MA)
The thick blue line indicates the exponential 13-day Moving Average (13DMA)
Bollinger Bands are abbreviated as BB. There is an upper and a lower Bollinger Band that varies in distance from a central moving average (shown as light red/pink) based on the volatility of stock price movements.
RSI stands for Relative Strength Index. It is an oscillator, which can be used to determine how overbought or oversold a stock may be.
The daily chart shows last week's bearish cross of the 20-day moving average through the 50-day moving average as price approaches the 100-day moving average from below. A failure to rally above the 100-day moving average will almost certainly see a test of the recent low.
The S&P 500 ETF, known as the Spyders (AMEX:SPY) is shown in the daily chart below:

The daily chart of the SPYders shows a failed attempt to close above resistance at the 100-day moving average. If the bulls fail to retake and hold this level, then a retest of the lows is likely.
This week's NASDAQ 100 ETF (QQQQ) Daily Chart is below:

The chart for the QQQQs also is seeing a challenge toward the 100-day moving average and also shows a bearish cross has already taken place. Not shown on the chart is the distribution the QQQQs have been undergoing, even as price moved higher. This is a bearish divergence suggesting another retest lower is likely.
This week's RUSSELL-2000 ETF (AMEX:IWM) Daily Chart is below:

The chart for the daily IWMs suggests that a reversal could be imminent. A doji with the cross bar at such a high level suggests indecision. Given that it is also on the 100-day moving average, a failure here will almost certainly lead to a significant sell-off.
In addition to our regular chart analysis, we thought it might be interesting to also examine some market internals that we regularly track. The number of stocks advancing versus the number of stocks declining are widely used by traders, and are combined with their relationship to up and down volume to create other indicators.
Today, we will just examine the advancers and decliners on the NYSE and the NASDAQ. In the charts, you will find 5-day moving averages and 8-day moving averages which illustrate when activity moves out of its normal range.

Note that both charts show the 5-day moving average climbing above the normal range and then moving sideways on February 1st. This led to a sideways move in both markets and a rally attempt. The weakening of that rally can be seen in the 5-day moving average failure to break back above the normal range, as it had on February 1st, which indicates the second rally was weaker than the first. This, of course, led to the large drop in the market the following Tuesday and the very evident break down below the normal range for the 5-day and 8-day moving averages for the advance/decline lines.
We now see that the ADV/DEC line (5-day moving average) is in the middle and approaching the top of its normal range, where it normally reverses and moves back toward the bottom of its range. You will note how it resembles a sine wave and tends to oscillate back and forth.
Will the ADV/DEC line break out above the normal range as the market continues to rally? You can't be sure, but the normal behavior of this oscillator is such that it tends to move up or down in a 5-day cycle, and we are only two days from the top. A failure of the major indexes to close above and hold their 100-day moving averages should be viewed as a viable shorting opportunity.
Conclusion:
Are we calling a bottom due to the VIX and VXN reversals? We think we did see a bottom on Tuesday, but that much is obvious. Will that bottom hold? We don't know, but we think a retest lower is likely to happen early in the coming week. If it doesn't happen then, we will have to consider opening long positions to benefit from potential bullishness which will likely become the mood.
With oil still above $60, it is in striking distance of the $64 resistance area. A decline below the $60 would be comforting to the markets now, and may aid the bullish cause if it occurs. With the warm weather expected in the coming week, this may be enough to see oil ease further.
The short positions on all of our index trades were closed at Tuesday's open netting better than 16% cumulative returns for short term trades. The coming week is options expiration, which tends to put a damper on things by the end of the week. However, the markets are looking for a catalyst and if it occurs a large move may still be in the making, so stay tuned.
Stay tuned for more.
Regards and Good Trading,


