


Weekly Trader Alert #97
3/27/2007 11:48:57 AM
Overview
The market closed with the Dow posting five up days in a row. The other major indexes weren't able to post such a string of gains, but overall finished the week significantly stronger than last week. Monday's M&A news seemed to allow investors to ignore some negative economic news, which was mostly the tone for the week. The market surged on Wednesday when the Fed softened its policy statement, removing the "additional firming may be required" statement in favor of another statement that higher inflation posed the most serious threat. They also added a statement about the adjustment in the housing market.
The equities markets interpreted this as the Fed will ease rates to alleviate a slowing economy due to the housing bubble bursting and the meltdown of the sub-prime lenders. We are still concerned about how many investors are choosing to ignore the sub prime issue, as we read about how small a percentage of the market the sub prime loans represent. In point of fact, they represent twenty percent of loans made in 2006, up from five percent of loans in 2005. While they amount to less than twenty percent of the mortgage dollars (each sub prime loan is generally less than the average loan size), it is still sizable.
The markets continue to mimic weakness of the Japanese Yen as they did a week ago. The Yen has reached nearly 118 to the dollar, so the collapse of the carry trade is certainly not imminent at this time.
Fear, as measured by implied volatility, and exemplified by the VIX and VXN has moved down. The put/call ratios also moved down after the Fed released their policy statement, so investors are currently complacent about downside risk.
Last week, we were looking for trading action on Monday to set-up the week. We expected it to be downward, but significant M&A news caused the markets to move higher.
Before we go deeper into what the rest of the week held, let's review economic reports released during the week.
Monday: The only economic report of significance Monday was the release of the NAHB/Wells Fargo housing market index. The index was reported at 36, from a downwardly revised February 39. This marks the first decline in the index since September, and means that about a third of the homebuilders believe the housing market is healthy. This news was ignored, so is presumably priced into the market. There was also significant M&A news that powered the markets higher.
Tuesday: Economic reports were focused on housing. New home starts surprised to the upside with an annual rate of 1.525M new homes started in February, versus the expected 1.46M. Of course this follows January's disastrous 1.399M number, so suggests that homebuilding isn't completely in the tank. Building permits, which are less volatile were reported at an annual rate of 1.532M versus expectations of around 1.57M homes.
Wednesday: The Fed policy statement gave equities investors what they wanted, which was a removal of some hawkish language and recognition of an adjustment in the housing market. It was like a bottle full of bees was shaken then uncorked. The markets surged on a very large one day move.
Thursday: Jobless claims came in roughly as expected reporting 316K versus an expected 325K. The big "miss" was really the leading economic indicators reported by the conference board. Consensus was that this number would be down 0.3%, but instead was reported at -0.5% and January's number was revised sharply down from a positive number to -0.3%. In addition to the economic reports, Motorola (NYSE:MOT) guided lower and announced changes in executive management.
Friday: The only economic report released Friday was existing home sales, which rose an unexpected 3.9% to 6.69M homes. However, inventories of new homes rose to a 6.7 month supply, and median prices are down 2.3% from a year ago. The National Association of Realtors (NAR) predicts a bottom for existing home sales in Q207. Monday, new home sales will be released and the NAR have predicted a bottom for those sales in Q307. Note: The NAR are notoriously optimistic and have a track record of calling the top late and the bottom early.
It is very important to note that existing home sales contracts were entered generally thirty to sixty days prior to their closing. February's report was for closings, which were signed in December and January. March and April's reports will reflect February closings, which we believe will drop significantly from the February report.
New home sales, were reported on Monday and fell far short of expections, which were for 995,000 new homes. Instead, 848,000 were reported, which is a miss of some 15%. The homebuilders had the opportunity to take down their forecast before the report is compiled which means that weather should not have been a factor, as the homebuilders can react to weather and take down their forecasts. There have been large downward revisions in these numbers for the last three months. Unsold inventories rose to 8.1 months from a previous high of 7.2 months. Median prices are only 0.3% lower than a year ago, while average prices are 7.5% higher, year over year. This indicates starter homes aren't selling which is linked to the sub prime woes.
New home sales are reported when the contracts are written. With an average of 40% of new home buyers walking away from their contracts, these sales are actually over representing what home builders are actually doing. It is always the case that some percentage of new home buyers cancel their contracts, but the current level is abnormally high. This means that this latest miss is actually worse than it looks on the surface. With sub prime loans representing 20% of mortgage loans written in 2006, new starter homes will have been disproportionately affected. With a tightening of abnormally loose credit, this will compound the problem even further.
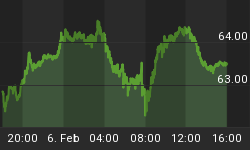
Oil closed near sixty-three dollars at $62.91. Natural gas also rose significantly to close at $7.383. The most important thing to watch for here is a move up to $64.00. If that occurs a break out upward would be indicated. Hovering in the range between about $57.00 to $63.00 won't likely affect the broad market significantly.
Overall, the economic reports last week were mixed, but the three primary market supporters were the M&A activity, the Fed's removal of a hawkish inflation bias, and the continued weakening of the Japanese Yen.
By the end of the week, Iran came back into focus, as Iran captured 15 British naval personnel. Iran was supposed to address the United Nations on Saturday, but chose not to do so. They were responding to their continuing progress on enriching uranium, in defiance of the UN. This seems to have caught the main stream media's attention, but hasn't really done much to investor sentiment in US markets.
The bulls once again have rekindled hopes that the Fed will lower rates, even in the face of higher inflation. We are not so sure, as food and energy prices continue to climb. The relationship between food and energy costs have recently been the subject of discussion, as ethanol production uses a large percentage of US corn production which drives up the prices of food products for humans and their pets, as well as to feed livestock, which increases the prices for meats and dairy products.
The U.S. government is subsidizing ethanol production. Presumably, this is so the United States can move away from a dependence on fossil fuels. The farmers are soundly defending the ethanol production subsidies by the government, as they are seeing outsized profits across the board. This is not confined to corn provided for ethanol production, but corn in general, which has caused more corn to be planted. Some fields that were growing wheat are now growing corn. Wheat prices are being driven up due to a shortage of wheat. We have already indicated meat and dairy prices are climbing because of the rising cost of feed.
All of this is inflationary, and depends, to a degree on the price of oil. If the price of oil drops significantly, then ethanol subsidies will come under scrutiny, and if rolled back, would result in food prices dropping once again, and inflation from food and energy would drop. Therefore the Fed needs to maintain higher rates to slow demand which can allow these prices to ease and may allow inflation to fall. If the Fed drops rates before inflation is clearly moving down, the risk of inflation rising out of control grow, and this would violate the Fed's mandate to keep inflation under control.
Market Climate
The market began the week with a move higher on M&A news and continued this move through the week, with some weakness toward the end of the week, particularly in the NASDAQ. The dramatic move up on Wednesday after the Fed's policy statement was released broke through resistance and the market consolidated those gains on Thursday and Friday.
The U.S. stock market composite chart:

The daily chart shows that price moved up and over the resistance of its 20-day and 50-day moving averages which should now provide support. As suggested last week, a successful close above the moving averages did result in a move up to the upper Bollinger Band. The question remains whether price will be reflected off of that band or whether price will begin to walk the band upward.
The indicator we show on the chart called On Balance Volume (OBV) indicates continued accumulation of shares. While it did show distribution just prior and through the Black Tuesday collapse, it has show steady accumulation for the last two and a half weeks. Monday actually showed a backing off from its zenith, but it is the trend that matters, not daily action.A failed test of this resistance will likely lead to a reversal at the upper Bollinger Band and a move lower to once again retest the recent lows.
We continue to watch semiconductors for leadership up or down. We include the daily chart below so you can see that we are watching for a break out of the ascending wedge, a break of support, or a break below the intermediate term uptrend channel.

These could lead to a tradable short in the semiconductors and would certainly dictate caution in long positions in these industries.
Fundamental Trends
The leaders are all about a continuation of the steel trade, the rise in the price of oil, and for whatever reason, continued interest in suppliers of painting products. All but painting products are easy to understand.
Painting products suppliers have shown a triple top as an industry in a little more than two months. Thursday's failure as the industry once again struggled to achieve a new high was followed by a couple of days of consolidation. We will be looking for any candidates in this industry that may be prone to profit taking as short candidates as the industry looks ready to give up its leadership position shortly.
The Industry leaders (ranked 1st-5th out of 190) are:
Leaders 3-26-2007 | Leaders 3-19-2007 | Leaders 3-09-2007 |
Steel (Alloy) | Petroleum (US Integrated) | Chemical (Fertilizers) |
Petroleum (US Integrated) | Chemical (Fertilizers) | Personal (Funeral Svcs) |
Petroleum (Mach/Equip) | Steel (Alloy) | Petroleum (US Integrated) |
Building (Painting Products) | Personal (Funeral Svcs) | Food (Dairy Products) |
Petroleum (Refining/Mktg) | Food (Dairy Products) | Machinery (Farm) |
There were three replacements in the cellar dwellers as the rally in the price of oil has removed that last vestige of weakness in oil names. Consumer electronics retailers have been replaced with computer retailers.
Both the financial mortgage service industry and the homebuilders are laggards due to the housing slowdown, and in particular, to the concerns highlighted by noted failures of sub prime lenders.
Computer retailers are in the laggards which is logical from the miss reported by Jabil systems last week (with their accompanying explanation of slowing business), as Jabil does a lot of contract manufacturing for this and related industries.
Airlines entered the cellar dwellers, presumable due to the rising price of oil, as their largest cost variable is from the cost of fuel.
Internet service providers are also in the cellar dwellers, which doesn't correlate with sub prime worries, the price of oil, the trouble in the Middle East, or the Yen carry trade. We don't have any explanation of this weakness other than perhaps profit taking as these stocks have been winners in 2006 and are fairly valued at this time with little further upside expected.
The Industry laggards (ranked 186th-190th out of 190) are:
Laggards 3-26-2007 | Laggards 3-19-2007 | Laggards 3-09-2007 |
Internet (Svc Providers) | REIT (Mortgage) | Building (Mobile/Mfg/RV) |
Retail (Computers) | Retail (Consumer Electronics) | Petroleum (Cdn Expl/Prod) |
Transportation (Airlines) | Financial (Mortgage Svcs) | REIT (Mortgage) |
Financial (Mortgage Svcs) | Building (Resid't/Com'l) | Building (Resid't/Com'l) |
Building (Resid't/Com'l) | Petroleum (Int'l Specialty) | Petroleum (Int'l Specialty) |
Trade Recommendations
We will continue to monitor the homebuilders, but the bottom is not yet in, and we don't want to get in prematurely. We will send out an alert when a bottom seems to have been hammered out. Given Lennar's (a competitor homebuilder) significant earnings miss and take down of their 2007 guidance, this may take awhile, so be patient.
We are now considering a short trade. Stock Option Speculator subscribers bought puts on Qualcomm (NASDAQ:QCOM) last week that already up some 20%. We expect QCOM to rally to around $43.33. A reversal downward from there confirms a short trade.

Current Portfolio
ROG continues to be a problem. We aren't certain if it will finally rally or if it will capitulate and move significantly lower. Keep your stop in place. We won't add our second half until it is clear that ROG has bottomed. If it bottoms at around $44.79, this would provide us with confidence to add to the position, but only after the bottom has clearly been put in.
RDY has failed to break through resistance and will likely consolidate here before moving higher. We will look to raise the stop to below a swing low, if we get the right action this week. This would also be the appropriate time to add the second half of our position, so stay tuned.
BPT has moved up nicely and is now above our initial target area where you should have locked in some gains at $65.25. we would like to lock in further gains at around $69.00 rather than hold out for $71.00 as this is a resistance area for the stock from a long term downtrend. Let's watch to see how things develop in the oil markets.
The three swing trades were all entered as half positions, given the market volatility. You will recall our entry was on Black Tuesday so the fact that two out of three are positive is a testimony to the strength of the stocks themselves.

FDG has rallied a bit to move back above twenty-three dollars.
* Initial stop prices are set to cause us to exit our positions if they close below these levels. You will note they are generally kept pretty tightly the opposite side of the trades we initiate. Historic volatility would imply that intraday price action may trade outside of these values, so that condition is insufficient to cause an exit from an existing position. On significant movement beyond our stop prices, we may issue an intraday message to exit the position or to maintain the position. You may chose to implement an absolute stop below these suggested stop values, but that stop should be wide enough to take care of the daily volatility for the stock in question. You can examine the candlesticks for an idea of intraday price fluctuations.
Entry prices are adjusted to account for dividends paid. The stock price was adjusted by your broker, to reflect the dividend taken out. The non-adjusted entry price reflects the actual entry price, without the adjustment for dividend values.
LVPB Concept: The concept is a Light Volume Pull Back, where a stock's price will pull back to a support level on light volume. Obviously, heavy selling is a sign of weakness, and we would not want to buy on a heavy volume pullback. However, we will occasionally place stocks on the LVPB (Light Volume Pullback List) to indicate a "re-entry" buying opportunity, when we have already entered a position. This should be used to add to existing positions, or to enter a position if you missed the initial entry.
LVPB Portfolio Stocks:
Conclusions
The markets moved up strongly on the release of the Fed policy statement. While it was clearly a break from the tightening bias, the Fed was still quite clear that their predominant worry is still inflation. While they acknowledged the "adjustment" in the housing market, we aren't certain that translates to looser monetary policy in the face of rising inflation from food and energy prices, as well as wage pressures.
We believe that the market will struggle to move higher at this time, as it is facing significant resistance overhead, and we believe that the market continues to be complacent in the face of increased risk to the market in terms of a further slowdown in the housing market, which could force a re-evaluation of the finance sector, which is the most influential sector in the broad indexes. The risk, going forward, is that the complacency we have been seeing will change to fear, based on some catalyst and the market could be vulnerable to another round of selling, perhaps as the market tries to overcome near term resistance, or as it tries to forge its ways above the highs reached in late February.
Monday's price action was mixed but that sets up Tuesday's action. When the upper Bollinger Band begins to move higher, this will signify greater volatility, and price will either follow it upward, or will reverse from it to move back down to likely test the mid-point or the lower Bollinger Band. All of the major index ETFs showed what is known as a hanging man or hammer candle. The hanging man marks a top, leaving buyers there hanging. It requires confirmation by a move lower. We expect trading action in the last hour will either see bulls come to the rescue, if the market is down prior to this, or will see a push by the bears to get the downside started yet once again.
With oil breaking below $60 and, in fact, below support at $57.40, a continued move to the downside should bolster the markets, generally, but will adversely affect the oil related companies, which are a large part of the S&P-500. Today (Monday) oil actually move lower to close at $56.59. Surprisingly, energy was the strongest sector today, with the underlying value of the oils outweighing the move lower for the price of crude.
For those of you who have enjoyed your subscriptions to the Fundamental Trader and who would like to get additional savings off the price of your subscription, you may consider an annual subscription to the service. You can save nearly 20% off of the monthly rate by selecting the annual subscription price. Just click on the link below:
http://www.stockbarometer.com/pagesMFT/learnmore.aspx.
Regards and Good Trading,


