


Just a few years ago, the majority of stock traders were oblivious to the excitement that base metals had to offer commodities stocks. Futures traders hustled and bustled to make a buck in their familiar base metals marketplace, yet not even they were aware of the eruption of capital that would eventually take these markets by storm.
Today the London Metal Exchange (LME), the world's largest non-ferrous metals exchange, manages over $10 billion of traded contracts each day with well over $2 trillion worth turned over annually. These are numbers that the LME says have increased by tenfold in the last 15 or so years. And it expects another double in the next three to five years.
A major catalyst to this growth stems from our growing global economy that has triggered a massive increase in the demand for industrial metals. These metals are responsible for expanding and renewing the world's physical infrastructure and are integral to the products and machinery that keep the wheels of global commerce greased.
And the demand for these industrial metals, or base metals, should continue to grow for many more years. Since the supplies of these metals are finite, and they are lagging to meet demand, base metals prices have been on a tear in recent years. The physical metals and the stocks of the companies that mine them have greatly rewarded investors and speculators thus far.
Now though it is very probable that the base metals will thrive in a secular bull market for many years to come, prudent traders need to be on top of current market conditions in order to stay ahead of the curve. And a wonderful attribute of the base metals in addition to their solid strategic fundamentals is their tactical and measurable real-time fundamentals.
These fundamentals are found in data that is provided by the LME. And the LME is one of the first places I go to gauge the health of the base metals sector as it is the leader among the global metals exchanges in capturing some of the core fundamentals of the base metals markets.
Not only is the LME the most reliable source for daily base metals prices in the world, but its various other functions are essential for commodities speculators. One such function includes providing the markets for futures and traded-options contracts. Aside from the speculative nature of futures and options, they are essential in mitigating risk allowing both consumers and producers to lock in prices, also known as hedging.
But the major function of the LME that I will focus on today surrounds the physical storage of its traded contracts. Now in order to ensure price convergence, all contracts traded on the LME "assume" physical delivery. Even though only a small percentage of contracts actually result in delivery, this physical realm is very important in the futures markets.
Since hedging and speculation dominate trading in the LME, a majority of contracts are sold or bought back before coming due for settlement. But LME contracts are occasionally redeemed and settled through the redemption of LME warrants. These warrants allow the bearer to obtain lots of a given metal from LME-approved warehouses around the world.
This physical storage is not designed to supersede existing supply chains such as those that exist between refineries and end users. But since global above-ground stockpiles are limited, when physical deliveries do occur to meet excess demand they really help paint a picture of the global supply and demand balance for the base metals. This action ultimately plays a large role in determining the day-to-day metals prices.
Today the 400+ LME-approved warehouses scattered across 13 countries provide critical stock data that not only the LME but traders around the world use to gauge the health of the metals markets. This stock data is published daily by the LME and as you will see in the upcoming charts is very useful as a leading indicator for the price action of the metals.
A couple weeks ago I penned an essay that analyzed the base metals technicals. Copper, zinc, nickel, lead and aluminum are the primary base metals that pique the interest of equity traders and are the most exciting in the volatile futures markets. Each of these metals is in the midst of its own secular bull market and their technical actions thus far have been simply mind-blowing to witness.
Sans aluminum, each of the base metals has had bull-to-date gains that have well outperformed the precious metals and the majority of the energy complex. Some incredibly strong uplegs have been host to wild parabolic ascents that have taken investors on exciting rides.
But in viewing the technicals it has been hard to establish a semblance of any trading patterns. I believe a large reason for this is the base metals' reactionary nature to the real-time fundamentals of inventory data. Because above-ground stockpiles have crept so low in recent years, speculative risk premiums have been built into the base metals prices. So when there is a swing in the stock data that the LME in particular provides, the markets are quick to react.
Because of this it is worth a visual look at the stock and price charts of the base metals in order to better understand this relationship. In the first edition of this base metals stockpiles and prices series that I wrote last year, copper was coming off a near double in the first half of 2006 as its LME-warehoused stock sunk to alarmingly low levels. From early March to its May top, copper rose 83% while copper stock dropped 33% to its early July lows.

Then after a somewhat uneventful price and stock consolidation through October, a near-textbook-perfect inverse correlation started to play out. In less than four months, copper stockpiles nearly doubled while copper corrected sharply shedding a third of its value.
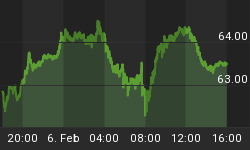
This run had a very strong negative correlation of -0.949 with an r-square of 90%. So 90% of the daily behavior of copper prices could be explained or predicted by the movement of its daily LME stock level. This copper correction had a very impressive inverse correlation with LME copper stock and this correlation has continued into copper's most recent upleg that began in early February.
Since its early February interim bottom, copper has had an impressive rally of 55% to its recent highs. And this has happened in unison with a 24% drop in copper stockpiles. This upleg is sporting a copper-to-stock correlation of -0.956 with an r-square of 91%. Not many fundamental drivers have had such measurable real-time correlations with an underlying asset as copper and many of the base metals do to their LME warehoused stocks.
Aside from these short-term correlations, it is also important to maintain strategic perspective on the stockpile data. Even though a double from 100k to 200k metric tons seems like a major structural change in LME copper stock, it is still historically very low. In 2002 LME copper stock was near the one-million-metric-ton level. So while 100k metric tons seems like a large supply increase in these short-term charts, today's levels are still 80% less than just five years ago. This is all the more impressive considering how much larger the global copper market is now compared to back then.
When looking at stock levels I think it is also important to consider the daily consumable supply above ground. For copper the 170k-metric-ton range puts it at less than four days worth of global copper consumption available. It is no wonder speculative risk premiums exist in copper and the other base metals. Any supply disruption would surely pinch the markets, which is why the recent labor problems at the massive Grasberg mine in Indonesia and many of the huge Chilean copper mines have been getting so much attention.
Shifting to zinc, it had an amazing 2006 run as its LME warehoused stock plunged in sharp linear fashion. A sizeable supply and demand imbalance emerged last year as LME warehouses were pilfered of nearly all the zinc consumers could get their hands on.

In 2006 LME zinc stock dropped an incredible 78%. And from its 2004 high of 780k metric tons, zinc stock has plunged a once-inconceivable 89% to its December lows. With its stock so low, on the order of less than three days of global consumption available, 2006 zinc prices skyrocketed by 142%.
This powerful zinc upleg finally gave up its ghost as zinc stock levels put the brakes on its freefall and began to stabilize toward the end of last year. Though zinc stock levels still remain historically low as they hover around the 100k-metric-ton level, a chunk of the speculative risk premium built into its price while it was freefalling was shaved off the top in quick fashion.
From its November high, zinc corrected by 34% in just 51 trading days to rest in what looks like an uptrending consolidation band near the highs of its early-2006 parabola. I find it amazing that stable zinc stock, no matter how low it is, is able to quickly quell the zinc-stock-to-zero sentiment that speculators built into zinc's price. This just confirms the incredible volatility in the base metals markets which really supports the importance of the hedging function for the end users and some of the weak-stomached producers of these metals.
Now nickel is a base metal that really captures the essence of the value the markets place in LME stock levels. Its supply deficit in recent years has truly been felt by the nickel industry. The warehouses that store LME-approved nickel have seen their inventory levels drop to dangerously low levels. Because of this nickel has truly become a hot commodity. Bull to date the price of nickel has soared over 1,000%!

LME nickel stock below 5k metric tons is equivalent to only about one day worth of global nickel consumption. An above-ground surplus of this small of an amount is just unthinkable. This poses a huge risk on the demand side of things as any increase in consumption will really pinch this market. And the financial markets are fully aware of this dilemma.
In 2006 alone, LME nickel stock fell by 89% prompting a wild nickel rally that saw this metal balloon by a massive 162%. And nickel's fortunes did not stop there with 2007 adding another 60% to recent highs as stockpiles continue to dwindle.
A huge speculative risk premium has been added to the price of nickel as the global nickel shortages continue. This further shows that fundamentals not only shift long-term price action but they can exert immediate and impactful pressure on real-time prices.
As I described in my base metals technicals essay two weeks ago, lead provides yet another example of the fundamental impact stockpiles can have on the technical nature of the metal price. While the other base metals were shedding weight in the warehouses and enjoying strong rallies last spring, lead bucked the trend and took a course of its own.

When you look at an LME lead-stock chart it becomes apparent why this was the case. In the first half of 2006 lead stockpiles actually rose by an impressive 181%. Lead subsequently shed 37% in this timeframe until it hit its interim bottom in June. And of course almost like clockwork, as LME lead stock started to fall the price of lead began to rise.
Since its June low, lead has been one of the strongest-performing base metals in the last ten months. With LME lead stock falling headlong by a whopping 74%, the price of lead has rocketed higher by a very impressive 124%. And though not as strong as copper, lead's inverse correlation through the span of this chart is an impressive -0.898 with an r-square of 81%. With less than two days of global daily consumption available in the warehouses, the markets really must pay attention to stockpile levels.
Aluminum is last but certainly not the least of the base metals. Measured by volume, more aluminum is produced and consumed each year than the previous four base metals combined. It is hard to tell in this short-term chart below, but aluminum has had a nice run since its 2001 low gaining 145% to its high last year.

With LME aluminum stock all over the board in the last year and a half or so, aluminum's price has been relatively stable outside of its May spike last year. Though the supply and demand for aluminum has greatly increased in recent years, there has not been as much of a pinch on the mining-side of things due to its abundance in massive ore bodies around the globe and the scalability of some of the larger mines.
This can be seen in aluminum's price stability amidst swings in its stock levels. Even with a recent 25% rise in stock, aluminum has been very stable in the last six months. As you can see in the chart its price has remained in a tight consolidation band and has not tanked based upon the parallel change in its stock level.
Even though LME aluminum stock levels are down from the 1.4 million-metric-ton range in early 2004, the above-ground supplies of the metal as measured by LME stock are not as alarmingly low as the other metals. Therefore the speculative risk premium attached to the other base metals is not as prevalent in aluminum as seen by its bull-to-date performance and its less responsive behavior to swings in its warehoused stock levels.
Any way you look at it, whether in aluminum or the more supply-pinched copper, zinc, nickel and lead, economics have and always will be the ultimate price driver for these commodities. The LME stock data really helps us to focus in on real-time economic fundamentals in these exciting base metals markets.
So as the global economy continues to grow in order to support its growing population as well as the fast-developing countries of Asia, commodities demand in general should continue to grow. With the dynamics of mining playing such a large role in supplying the markets' demands for the base metals, it should continue to be a wild ride for investors and speculators in the coming years.
And the best way to take part in the base metals bull is to buy the stocks of the companies that are charged with bringing these metals to the markets. The base metals mining stocks have been among the hottest stocks in the stock markets in recent years and have greatly rewarded shareholders thus far.
But this base metals bull market is likely far from over. Probabilities highly favor today still being in the first half of a secular bull market for the base metals that should thrive for another decade or so. Because of this, legendary gains are still likely to be won in the base metals stocks.
At Zeal we have been recommending elite base metals stocks among other commodities stocks to our newsletter subscribers since the beginning of this bull market and have been blessed with some incredible realized and unrealized gains. If you'd like cutting-edge commodities markets analysis and trade recommendations for high-probability-for-success stocks, then please subscribe today to our monthly newsletter.
Our newsletter subscribers also gain exclusive access to the private charts section of our website. With LME stock data proving to be a very important metric for traders to observe, we recently added high-resolution versions of the charts seen in this essay to our charts section and update them weekly so you may monitor these base metals fundamentals yourself.
The bottom line is the recent inverse correlation between base metals prices and their LME stock levels is proving to be an exceptionally valuable tool for base metals traders to observe. With the tight supply of base metals in today's markets, any swing in stock levels has greatly influenced these metals' price actions.
The fundamental drivers of the base metals bulls are real and measurable with this LME data. And investors and speculators should be able to capitalize on this supply crunch by buying the stocks of the companies that bring the base metals to market. With stockpile levels so low and continued demand growth on the horizon, the base metals miners are poised to be marvelously profitable for years to come.


