

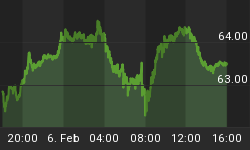


Does this look like a picture of a recession to you?

Chart 1
Of course not. But, if you had been feeling a little despondent about our economy, then Wall Street's propaganda machine had gotten to you. It sure had gotten to the Fed and forced the Fed's hand to slash the Fed Fund's rate by a whopping 0.50% on 9/18/2007. As I mentioned in my 9/16/2007 editorial, the same Wall Street cheerleading squad that used to dispute vehemently any notion of a recession just a couple of months ago is now throwing the R word around more frequently than the rerun of Frasier.
Recession is commonly defined as having 2 consecutive quarters of decline in real GDP. Another well known source of reference is the National Bureau of Economic Research (NBER), which assigns dates to the peaks and troughs that frame economic recession or expansion. Neither the common definition nor the NBER had indicated that we're in a recession.
Another important measure of economic activity is the spending on constructions. Construction has been a major source of employment, and the total amount spent on construction is about 10% of our GDP. This significant economic activity has shown no sign of relenting despite slowdown in residential construction. Chart 2 below shows total construction spending holding steady above $1.16 trillion level. Although the spending's down 2.77% from August last year (black arrow), it's still up 4% from August 2005 (white arrow). The strength in total construction is due primarily to growth in Non-Residential construction.

Chart 2
Non-residential construction had picked up where Residential construction left off when they crossed paths in January 2007 (see blue circle on Chart 3 below). The surge in construction spending on education facilities, lodging, office, power plant, health care, communication, and commercial properties pushed non-residential construction spending above $580 billion for the 1st time and ahead of the declining residential construction spending. Had this trend kept up into the future, the loss in residential construction spending might become immaterial.

Chart 3
And, as for having the money to continue spending, the latest DPI (Disposable Personal Income) statistics indicated an increase of 0.36% or $32.7 billion in August. Total DPI for August was $10.28 trillion (Chart 4).

Chart 4
In addition, the 52-week ROC (rate of change) of M1 money supply (cash in hands of public) appears to be making a comeback after dipping into the negative territory in the first half of 2007 (blue arrow on Chart 5). During the past periods of economic slowdown, this ROC showed the propensity to fall into the negative area (red arrows). I also mentioned in the past that the rise of this ROC has to do with the housing market boom as the proceeds from the sales or the refi got deposited into homeowners and escrow services' demand deposit accounts. Recent uptick of this ROC may indicate increased activities in the real estate sales or the mortgage refi market.

Chart 5
There's a probability that the U.S. economy may dive into a recession sometime in the future. The only problem is that I (and everyone else) don't have the ability to see the future. All I have is the ability to listen to the language of the economy and the market. And, I've heard no tale of a recession so far. In fact, the illustrations above show that the economy continues to be in the expansion mode albeit debatably at a slower pace. Adding extraordinary amount of liquidity to an expanding economy may be hazardous to the long-term financial stability.
The new round of drastic yet unnecessary re-inflation may end up hurting both Main Street and Wall Street more than expected. I'm sure we can always count on Wall Street to campaign for what's best for Main Street. We can just as well count on the Fed led banking cartel to do what's best for Wall Street. And, the American consumers can be counted on to pay their best, through property foreclosures and bankruptcies, for everything. And, since everyone's doing their best, I'm sure this will all happen soon.


