"No warning can save people determined to grow suddenly rich" - Lord Overstone
 |
Gold •583 days | 2,368.70 | +35.30 | +1.51% |
|
Platinum •15 mins | 2,099.40 | +28.80 | +1.39% |
|
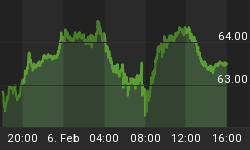
WTI Crude •19 hours | 63.55 | +0.26 | +0.41% |
|
Gasoline •19 hours | 1.953 | +0.027 | +1.38% |
|
Ethanol •583 days | 2.161 | +0.000 | +0.00% |
|
Silver •583 days | 30.82 | +1.16 | +3.92% |
 |
Silver • 583 days | 30.82 | +1.16 | +3.92% | |
|
Copper • 583 days | 4.530 | +0.111 | +2.51% | |
|
Brent Crude • 18 hours | 68.05 | +0.50 | +0.74% | |
|
Natural Gas • 19 hours | 3.422 | -0.087 | -2.48% | |
|
Heating Oil • 19 hours | 2.413 | +0.020 | +0.84% |
Greg Troccoli

Contributor since: 07 Jul 2011
Biography
Greg created The Chart Lab to deliver timely, actionable and unique Technical Research to both the professional and individual investor. Unlike most services, our research is simple and straight forward to comprehend, but highly actionable to identify market themes and generate impactful trade ideas.
-
Where is this Market Heading?
Larger Image Today, we are about to hit our first level we called for on Sunday on the S&P 500 1235. We have remained bullish…
-
What Investors Need to Know for the Week of the 26th
CME - S&P 500 INDEX (Sept) - Daily Updates Let us help you make sense of it all. $100 off - Sign up now The…
-
SP 500, Gold and Crude Oil Levels We Are Watching
CME - S&P 500 INDEX (June) - Daily Intermediate Trend (3 Months): Negative Tuesday's Close: 1204.80 (-3.30) UPDATE: Four weeks ago, at the height of…
-
Not the Time to Panic
Larger Image Within the last nine trading days, the U.S. Stock Market, and specifically the S&P 500 Index, appears to be in a meltdown phase.…
-
Two Global Markets showing Intermediate Strength
JGB- TOKYO TEN YEAR - Weekly Intermediate Trend (3 months): Positive Friday's Close: 14182 A (- 1) UPDATE: At the end of March we noted,…
-
Two Charts to Look At
CBT - U.S. TEN YEAR NOTE (Sept) - Daily Near Term Trend: Positive Thursday's Trade: 124'10 (- 9.0) Yield: 2.96% UPDATE: As our readers are…
-
Remain Long Gold, Unless.........
As of Wednesday, July 13, 2011, Gold traded to a new historical high at $1.578.50 / ounce. The up-trend line (denoted in blue) has been…
-
SP 500 Index Will Post New Historical Highs Before Year-End
My opinion published 12 months ago, in July 2010 (lone wolf amongst all analysts), as the S&P 500 Index was falling, and trading near the…
Sign up to the
Safehaven Market Insider


