


The good news is:
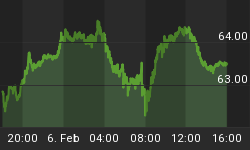
• Except for the Dow Jones Industrial Average (DJIA), all of the major averages closed at multi year highs on Friday.
Since interest rates were dropped to historically low levels nearly 10 years ago breadth indicators derived from NYSE data have been wildly positive leading me to regard them with suspicion. Now, for the first time in many years, breadth indicators derived from NYSE data are weaker than those derived from NASDAQ data. This would normally be considered a positive, but, it is so unusual it makes me uneasy.
The negatives
Advance - Decline lines (ADL) are a running total of declining issues subtracted from advancing issues. Their bias varies widely and occasionally shifts. The shifts are usually important. The NYSE ADL, an ADL calculated from NYSE issues has had a wildly positive bias for nearly 10 years and hit an all time high in early November. For the past 2 weeks as the small and mid cap indices have hit new highs the NYSE ADL has failed to confirm those highs.
The chart below covers the past 6 months showing the S&P 500 (SPX) in red and the NYSE ADL in blue. Dashed vertical lines have been drawn on the 1st trading day of each month.
The SPX closed at a multi year high Friday while the NYSE ADL failed to confirm that high.

There were 431 new highs on the NYSE on Tuesday, that number was cut in half to 203 on Friday when the SPX closed at a multi year high.
The chart below covers the past year showing the SPX in red and a 10% trend of NYSE new highs (NY NH) in green.
NY NH fell while the SPX rose to a new multi year high. Over the past year this indicator has been in a down trend that accelerated last week.

The next chart is similar to the one above except it shows the NASDAQ composite (OTC) in blue and OTC NH has been calculated from NASDAQ data.
OTC NH closed slightly above its November high, but well below its April high.

The next chart shows the SPX in red and a 10% trend of NYSE new lows (NY NL) in blue. NY NL has been plotted on an inverted Y axis so decreasing new lows move the indicator upward (up is good).
Last week new lows increased while the SPX was rising.

About half of the issues traded on the NYSE are fixed income related and fixed income had a bad week. For about 85 years, until about 10 years ago, fixed income prices and equity prices moved in synch.
Last week may turn out to be an insignificant historical aberration or maybe not. For the time being NYSE and NASDAQ breadth indicators are out of synch.
The positives
The chart below is an update of one I have been showing every week, it covers the past 6 months showing the OTC in blue and a 40% trend (4 day EMA) of the ratio of NASDAQ new highs to new highs + new lows (OTC HL Ratio) in red. Dashed horizontal lines have been drawn at 10% levels of the indicator; the line is solid at the neutral 50% level.
There are trading systems that impose a No Sell filter when variations of this indicator are above 80%. It reached 89% Friday.

The next chart is similar to the one above except is shows the SPX in red and NY HL Ratio, in dark blue has been calculated from NYSE data.
NY HL Ratio fell last week and, for the first time in memory, is lower than OTC HL Ratio.

The chart below covers the past 6 months showing the OTC in blue and an advance - decline line calculated from NASDAQ data (OTC ADL) in green.
OTC ADL closed at a 6 month high on Friday.

To give you a historical perspective, the chart below is similar to the one above except it covers the past 5 years. Dashed vertical lines have been drawn on the 1st trading day of each year.
This indicator has an extremely negative bias so a short term show of strength as we are seeing now is significant.

Seasonality
Next week includes the 5 trading days prior to the 3rd Friday of December during the 2nd year of the Presidential Cycle.
The tables below show the return on a percentage basis for the 5 trading days prior to the 3rd Friday of December during the 2nd year of the Presidential Cycle. OTC data covers the period from 1963 - 2009 and SPX data from 1953 - 2009. There are summaries for both the 2nd year of the Presidential Cycle and all years combined. Prior to 1953 the market traded 6 days a week so that data has been ignored.
Returns by all measures have been modestly positive.
Report for the week before the 3rd Friday of December.
The number following the year is the position in the presidential cycle.
Daily returns from Monday through 3rd Friday.
| OTC Presidential Year 2 | ||||||
| Year | Mon | Tue | Wed | Thur | Fri | Totals |
| 1966-2 | 0.58% | 0.65% | 0.09% | 0.04% | -0.57% | 0.78% |
| 1970-2 | 0.35% | -0.74% | -0.14% | 0.11% | 0.28% | -0.13% |
| 1974-2 | -0.62% | 0.58% | 0.74% | -0.29% | -1.33% | -0.92% |
| 1978-2 | 0.32% | -0.55% | -0.31% | 0.02% | -0.63% | -1.15% |
| 1982-2 | -0.22% | -0.86% | -2.44% | -0.04% | 1.48% | -2.08% |
| 1986-2 | -0.73% | 0.13% | -0.42% | -0.26% | 0.24% | -1.04% |
| Avg | -0.18% | -0.29% | -0.51% | -0.09% | 0.01% | -1.06% |
| 1990-2 | -0.84% | 1.22% | 0.28% | 0.29% | 0.35% | 1.30% |
| 1994-2 | 0.01% | 0.05% | 0.86% | 0.69% | -0.22% | 1.39% |
| 1998-2 | -3.07% | 2.32% | -0.16% | 1.72% | 2.06% | 2.87% |
| 2002-2 | 2.78% | -0.59% | -2.19% | -0.54% | 0.66% | 0.11% |
| 2006-2 | 0.23% | -0.46% | 0.03% | 0.88% | 0.14% | 0.82% |
| Avg | -0.18% | 0.51% | -0.24% | 0.61% | 0.60% | 1.30% |
| OTC summary for Presidential Year 2 1966 - 2006 | ||||||
| Avg | -0.11% | 0.16% | -0.33% | 0.24% | 0.22% | 0.18% |
| Win% | 55% | 55% | 45% | 64% | 64% | 55% |
| OTC summary for all years 1963 - 2009 | ||||||
| Avg | -0.01% | 0.11% | -0.05% | -0.04% | 0.20% | 0.22% |
| Win% | 51% | 51% | 50% | 57% | 60% | 60% |
| SPX Presidential Year 2 | ||||||
| Year | Mon | Tue | Wed | Thur | Fri | Totals |
| 1954-2 | 0.09% | -0.69% | 0.61% | 1.07% | 0.26% | 1.33% |
| 1958-2 | 0.28% | 0.37% | 0.65% | 0.43% | -0.15% | 1.59% |
| 1962-2 | -0.32% | -0.48% | 0.82% | 0.38% | -0.29% | 0.12% |
| 1966-2 | 1.05% | -0.33% | -0.11% | -1.21% | -0.07% | -0.67% |
| 1970-2 | -0.51% | -0.16% | 0.07% | 0.36% | 0.20% | -0.04% |
| 1974-2 | -0.91% | 1.69% | 0.47% | -0.37% | -1.09% | -0.21% |
| 1978-2 | 0.50% | -0.54% | -0.55% | -0.02% | -0.74% | -1.35% |
| 1982-2 | 0.27% | -1.83% | -1.56% | 0.04% | 1.62% | -1.46% |
| 1986-2 | 0.35% | 0.74% | -0.99% | -0.32% | 1.20% | 0.97% |
| Avg | -0.06% | -0.02% | -0.51% | -0.06% | 0.24% | -0.42% |
| 1990-2 | -0.24% | 1.24% | 0.05% | -0.02% | 0.49% | 1.51% |
| 1994-2 | 0.56% | 0.15% | 1.07% | 0.08% | 0.76% | 2.62% |
| 1998-2 | -2.17% | 1.89% | -0.07% | 1.55% | 0.68% | 1.88% |
| 2002-2 | 2.35% | -0.81% | -1.31% | -0.77% | 1.30% | 0.75% |
| 2006-2 | 0.23% | -0.10% | 0.12% | 0.87% | 0.11% | 1.22% |
| Avg | 0.14% | 0.47% | -0.03% | 0.34% | 0.67% | 1.60% |
| SPX summary for Presidential Year 2 1954 - 2006 | ||||||
| Avg | 0.11% | 0.08% | -0.05% | 0.15% | 0.31% | 0.59% |
| Win% | 64% | 43% | 57% | 57% | 64% | 64% |
| SPX summary for all years 1953 - 2009 | ||||||
| Avg | 0.05% | 0.19% | 0.06% | -0.05% | 0.19% | 0.42% |
| Win% | 55% | 50% | 54% | 46% | 60% | 61% |
Conclusion
Since the late August lows the DJIA has rallied 14% while the Russell 2000 (R2K) is up 30%. Since their November lows the DJIA is up 3.7% while the R2K is up 10.1%. The market is overbought. Breadth indicators are mixed, those derived from NASDAQ data are strong while those derived from NYSE data are weak.
I expect the major averages to be lower on Friday December 17 than they were on Friday December 10.
Last weeks forecast based on conditions similar to those found this week was a miss.
Gordon Harms produces a PPT for our local timing group meeting. You can get a copy of that at: http://www.stockmarket-ta.com/
I have received several links to a cute video explaining Quantative Easing. You can see that at: http://www.youtube.com/watch?v=PTUY16CkS-k
This report is free to anyone who wants it, so please tell your friends. They can sign up at: http://alphaim.net/signup.html. If it is not for you, reply with REMOVE in the subject line.
In his latest newsletter Jerry Minton looks at the idea that continuous exposure to stocks is the way to get the "average" long-term return of the market. If you are retired or about to retire, you will want to read "Unnecessary Risks" at www.alphaim.net and sign-up for Jerry's free bi-weekly newsletter.
Thank you,


