


| TREND | MOMENTUM | COMMENT | |
| Long-term | 2 of 2 are BUY | ||
| Intermediate | 3 of 5 are BUY | 4 of 5 are NEUTRAL | SPY ST Model in BUY mode; Non-Stop in BUY mode. |
| Short-term | Model is BUY | 5 of 6 are NEUTRAL | I hold no position over the weekend. |
| GANN DAY | MOON:SOLAR | CYCLE | CONCLUSION |
| 12/09,12/11 | 12/05 : 12/07 | 12/26 | Next pivot date: 12/09 - 12/11 |
| BULLISH | 09/27 Market Recap: 9 POMO within 20 trading days means 14%+ up in 3 months. 10/01 Market Recap: Positive September plus mid-term election means 11%+ up to year end. 10/29 Market Recap: The last 2 months of year are bullish. 11/05 Market Recap: SPX daily bar completely out of BB may mean bulls are safe till the year end. 6.3.1a Major Accumulation Day Watch: 2 MAD within 5 days means a tradable bottom at least. *1.0.0 S&P 500 SPDRs (SPY 60 min): Ascending Triangle breakout, target $125.61. |
| BEARISH | 1.0.6 SPY Unfilled Gaps: 22 unfilled gaps, the max is 22. 10/29 Market Recap: Commercial (smart money) short Nasdaq 100 heavily according to COT Report. *12/10 Market Recap: Smart/Dumb money confidence spread too high. 0.2.1 10Y T-Bill Yield: ROC(30) >= 9, topped? (Due to Quantitative Easing, I'm not sure if it still works) 1.2.0 INDU Leads Market: INDU had a lower low, so SPX might follow eventually. *8.2.7b Record High ISEE Equities Only Index Readings 2010: 2nd record high, top is close? *12/10 Market Recap: Too many Sentimentrader's indicators are at bearish extremes. |
| SPY SETUP | ENTRY DATE | STOP LOSS | INSTRUCTION: Mechanic signals, back test is HERE, signals are HERE TRADING PLATFORM: SSO/SDS, UPRO/SPXU |
| Non-Stop | 09/07 L | N/A | |
| ST Model | Buy mode doesn't mean long, a 2nd buy signal is needed to enter long. | ||
| NYMO Sell | 12/09 S | 2*ATR(10) | Reference only, not meant to be followed. |
SHORT-TERM: BEARISH EXTREMES GO TO EXTREME
Bears wasted perhaps the best week in December to counter-strike, now at least from seasonality point of view, the weeks to follow are more and more bear unfriendly. However, many indicators which were already at bearish extremes now go to even more extreme, so we're going to need a lot of imagination to foresee how bullish the next week could be.
- According to seasonality chart as well as the Stock Trader's Almanac, the general pattern next week should be a consolidation for the first half week at least and if any loss, the Triple Witching Friday would recover all of them.
- The short-term target could be $125.61, according to the SPY Ascending Triangle text book target.


Let's see what I mean "bearish extremes go to extreme":
8.2.7b Record High ISEE Equities Only Index Readings 2010, the 2nd record high, at the time, ISEE Index itself is at 5 year high, which in another word is retailers bought lots of calls (call to put ratio > 3) in anticipation of "fill whatever reasons you can think of here". (For the past record readings please refer to 8.2.7a Record High ISEE Equities Only Index Readings 2006 - 2007)


Smart Money / Dumb Money Confidence Spread from Sentimentrader also hit the 2nd or 3rd record high in 5 years. Especially the Dumb Money Confidence (aka our retailers) is now at 5 year new high at least.

45% Sentimentrader's indicators are now at bearish extremes. This is very high percentage. The statistics below also comes from Sentimentrader (the condition was met on 12/07):
Since 2000, there have been 37 days when 30% or more of our indicators were bearish for the market, and 0% were bullish. Thirty days later, the S&P 500 was positive 3 of those days (an 8% winning percentage) and sported an average return of -4.4%. The maximum loss during the 30-day stretches averaged -8.1% versus a maximum gain of +2.2%, so quite a negative skew. We've seen in twice so far in the past year, right before the January and April peaks.

INTERMEDIATE-TERM: BULLISH, TARGET SPX 1300+
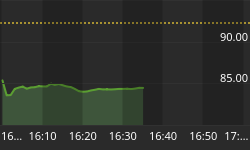
SPX clearly breakout above 1227, so as mentioned in 12/03 Market Recap, it confirms the 5th wave up to 1300+. There's more bullish count of course, such as 3 of primary 3 up. I don't care how wave is counted as long as I know it's bullish. The catch, as already mentioned in the short-term session above, is way too many bearish extremes, while we retailers are very high but in reality, see chart below, at least the past 9 trading days was the weakest since April in terms rising points. So I believe, soon or later there'd be a little bit bigger pullback similar to that of November or even April, so for now, count this as a wave 5 up is quite reasonable.

The charts below are for info only, not meant to imply anything for now because they may take fairly long time to work.
4.0.7a Collection of Leading Indicators I, too much too large negative divergence.

1.2.0 INDU Leads Market, according to Dow Theory, INDU and UTIL haven't confirmed the SPX and TRAN new high yet.

SEASONALITY: BULLISH MONDAY, FRIRDAY AND THE WHOLE TRIPLE WITCHING WEEK
According to Stock Trader's Almanac:
- Monday before December Triple Witching Dow up 3 of last 4.
- December Triple Witching, Dow up 18 of 27, with history of huge gains. 1982 +2.2%, 1987 +2.6%, 1992 +1.4%, 1994 +1.1%, 2002 +1.8% and 2007 +1.6%.
- December Triple Witching week, Dow up 22 of last 25.
See 12/03 Market Recap for December seasonality chart.
HIGHLIGHTS OF THE OTHER ETFS IN MY PUBLIC CHART LIST
| SIGNAL | COMMENT | |
| QQQQ | 12/02 L | |
| NDX Weekly | UP | *NASI STO(5,3,3) oversold and buy signal. |
| IWM | ||
| IWM Weekly | UP | |
| CHINA | Could be a Bear Flag in the forming. | |
| CHINA Weekly | UP | |
| EEM | ||
| EEM Weekly | UP | |
| XIU.TO | 12/02 L | |
| XIU.TO Weekly | UP | |
| TLT | Test the previous low so there're some chances TLT may be bottomed here. | |
| TLT Weekly | DOWN | |
| FXE | ||
| FXE Weekly | DOWN | |
| GLD | ||
| GLD Weekly | UP | |
| GDX | 12/02 L | |
| GDX Weekly | UP | |
| USO | Bearish Engulfing plus channel resistance, could see more pullbacks. | |
| WTIC Weekly | UP | |
| XLE | 06/15 L | |
| XLE Weekly | UP | |
| XLF | 10/15 L | |
| XLF Weekly | UP | |
| IYR | Could be a Bear Flag in the forming. | |
| IYR Weekly | UP | Home builders are lagging. |
| XLB | 12/01 L | |
| XLB Weekly | UP |
- Please make sure you understand how to use the table above. The purpose of this report is to provide info so contradictory signals are always presented.
- Position reported in short-term session of the table above is for short-term model only, I may or may not hold other positions which will not be disclosed.
- Conclusions can be confirmed endlessly, but trading wise, you have to take actions at certain risk level as soon as you feel the confirmation is enough. There's no way for me to adapt to different risk levels therefore no trading signals will be given in this report except the mechanical signals such as SPY ST Model.
- * = New update; Blue Text = Link to a chart in my public chart list.
- Trading signals in OTHER ETFs table are mechanical signals. See HERE for back test results. 08/31 L, for example, means Long on 08/31.
- UP = Intermediate-term uptrend. Set when I see at least one higher high and higher low on weekly chart.
- DOWN = Intermediate-term downtrend. Set when I see at least one lower high and lower low on weekly chart.


