


Oil prices ramped up further this morning, and then plunged nearly $7 when Saudi Arabia was said to be "in talks" to boost oil output in order to cover lost shipments from Libya. According to the Wall Street Journal, the Saudis have more than 3mbpd of spare capacity.
That's all well and good, and the U.S. also has a Strategic Petroleum Reserve that can cover some lost output temporarily. But here's the little problem. The source for our estimate of Saudi excess capacity is...the Saudis. But they're currently producing around 9mbpd, and have never produced more than about 9.5mbpd. Furthermore, it seems the general consensus is that their major oil fields are in decline. Some people even believe that the decline has been accelerated by the Saudi's efforts to keep the flow rate higher than it should be so as to make it appear as if they are not in decline. I will be interested to see if the Saudis can really pump their output up to 10.2mbpd just like that (snapping fingers). I am much more confident that the SPR can supply 1mpbd, at least for a little while, than that the Saudis can. I think energy traders are being surprisingly cavalier here.
And interestingly, there is a new way to play this outlook, if you want to. Some friends of mine at Factor Advisors rolled out "FactorShares" today, which the press release calls "The First Family of Spread ETFs." These instruments allow you to take a levered long position and a levered short position in another market in a single package. For example, the FOL allows you to be bullish on oil and bearish on the S&P at the same time. Other flavors include FSE (S&P bull/TBond bear), FSU (S&P bull, USD bear), and FSG (Gold bull, S&P bear). You have a 2x position in each leg, so you are 4x levered.
While I like the idea of FactorShares, and I expect they will be quite popular, there are two niggling complaints I have. The first is that these aren't spreads at all - most of them are going the same way. That is, being bullish on stocks is a position that should have a positive correlation with being short on bonds. It's the old "Texas hedge!" However, for some of them it's an open question: oil and S&P may sometimes move together and other times move inversely. But these are potentially quite risky. The second complaint is that the positions are chosen to be dollar-weighted. That's not the way an arbitrageur would choose his weights. Someone going long bonds and short stocks is mostly just short stocks since the volatility of equities is much higher than the volatility of bonds. Still, this isn't a fatal flaw in the FactorShares: they have to choose some weighting scheme, and something simple probably makes more sense (especially since correlations can and do shift all the time). Someone who really wants to weight the positions correctly has lots of ways to add a risk tail to one side or the other (for example, FSE might be combined with some TBT (the 2x inverse bond fund) to get volatility-weighted amounts.
It's a good idea. Now they need to do a simple breakeven (long TIPS, short TBonds) so retail can get long inflation duration as distinct from getting long real rate duration.
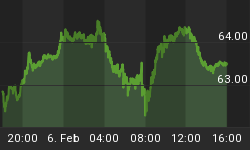
The drop in oil (on a close-to-close basis it was only about $1) helped stocks to recover after breaking below 1300, and the market closed with a small loss but above the trendline I drew yesterday. Still, to say the position is tenuous is probably fair. Volumes were again respectable, and although the VIX retreated slightly it is still elevated by recent standards.
Economic data were mixed. Initial Claims was 391k, and as the seasonal flopping around seems to be diminishing I probably need to revise my expectation about what is the underlying trend to more like 410k than the 420k I had thought. Statistically-speaking I don't have enough evidence to reject the 420k from just the Claims data, but there are enough other signs that nudging it lower seems reasonable. But I still don't see it as a downtrend and more of a down-shift.
Durable Goods was weak, no two ways about it. Ex-transportation, orders fell -3.6% in January, although an upward revision of 2.5% to December helps take some of the sting out. Still, all of the measures that correlate to GDP growth started Q1 on a very poor path, although the quarter has a long way to go.
New Home Sales were predictably awful, at 284k only 10k above the lowest of the cycle. At least the level of inventory continues to decline, for both New and (more importantly) Existing Home Sales (see Chart, source Bloomberg).

Existing homes for sale (seasonally adjusted). Still high, but becomingreasonable.
The current level of Existing Home Sales correlates to a level of CPI Shelter inflation right on top of the intended FOMC target: about 1.8%...however, given the lags involved that y/y change isn't to be expected until January 2013 (although the early-2010 dip should show up in early 2012).
Today was actually, when you compare it to the last few days, fairly calm. And yet, stocks couldn't manage a rally of any note. The selloff has not been so long-lasting, nor so deep, as to call this lack of bounce "striking," except in the context of the last few months' worth of uninterrupted rally. What is striking is that such a feeble little selloff is itself striking.
On Friday the second cut of Q4 GDP is released, and the revision to the Michigan confidence figure. Neither should have much impact on markets. Far more important is the Irish election and the post-mortems written after the results come out, and the fact that the weekend's approach will make investors commit to where they want to be for another couple of days. It has been some time since the market showed any signs of concern about the weekend. I am not sure whether the lack of information out of Libya makes things seem calmer than they actually are (since we are not bombarded with the news and pictures) or whether it contributes to an underlying sense of tension since we are used to getting that kind of information deluge.


