


Graceland Updates 4am-7am
May 7, 2013
-
Gold has stalled in the $1485 area. Is the rally in gold over, or about to accelerate?
-
Please click here now. You are looking at the daily chart for gold. Technically, the gold price is moving sideways in a rough congestion pattern, between $1440 and $1480.
-
I've highlighted the trading range with blue and red HSR (horizontal support and resistance) lines. These types of patterns have a 2/3 chance of consolidating the existing trend, which means there is a 2/3 chance of an upside breakout.
-
Please click here now. That's also a daily gold chart. You can see that the next key HSR areas are near $1400 and $1540.
-
If gold can trade above $1485, it's got a realistic chance of rising to $1540.
-
Note the position of my "stokeillator" (14,7,7 Stochastics) series on both those charts. It's not overbought, but it's high enough that investors need to be somewhat cautious.
-
The media has reported substantial "mom and pop" gold buying, around the world. Chinese, Japanese, and Indian households are accumulating gold, but so are households in America, Canada, England, and Australia.
-
That buying is being countered by ETF selling, and this "battle" is likely creating the range between $1440 and $1480.
-
Please click here now. That's a shorter term look at gold, over the past month. Gold is trading in an uptrend. A break under $1425 would be a negative event, but a minor one.
-
Obviously, the decline from $1500 to $1320 has left a lot of gold investors stunned. In a situation like this, I think it's important to keep things very simple, or you can create a panic in the "gold building", when there is no fire.
-
Not all bank brokerages have a negative outlook for gold, and those that do are mostly from outside of Asia. TD Securities, for example, is forecasting an average 3rd quarter price of $1550.
-
To view their opinion in detail, please click here now.
-
Obviously, if the price were to average $1550, it would almost certainly trade quite a bit higher than that, at some point during Q3!
-
While gold has fallen by a greater percentage than it did during the recent crash, Mid-East dealers believe it has never crashed so "hard".
-
The violence of the crash has resulted in Mid-East dealers hoarding gold bars. Some people are calling the crash the biggest in 70 years. They believe much higher prices are coming after such an ordeal, and refuse to sell.
-
Please click here now. That's a link to a Daily Telegraph article that shows the incredible demand for physical gold in the Mid-East.
-
There's a global "show of hands" for physical gold, but what about silver?
-
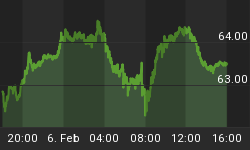
Please click here now. You are looking at the hourly bars chart for silver. It's drifting sideways in a range between roughly $21 and $24.50, but it will likely be the price action of gold that determines the next big move for silver.
-
I think that silver will grind its way higher, towards the $27 area, while many bears think it is headed towards $18.
-
Gold stocks are struggling, and some analysts believe they are a leading indicator for gold.
-
Please click here now. Double-click to enlarge. You are looking at the daily chart of GDX. On May 6, the gold stocks market traded like it was a holiday; the lights were on, but nobody was home.
-
Note the declining volume. That's bearish. GDX is also barely above the 10 day moving average, which is negative.
-
Still, there is hope; double bottom patterns tend to show very little volume on the 2nd bottom.
-
If GDX drifts down towards the $27.27 area lows, over the next few weeks, it's quite possible that a small double bottom pattern could be in play. GDX needs to close over $30 on strong volume, to reinvigorate the entire gold stocks sector!
Special Offer For Website Readers: Please send me an email to freereports4@gracelandupdates.com and I'll send you my free "Riding The Rails" report. I show you how to apply slanted trend lines to the current precious metals markets, so you can see where prices may hesitate, and surge!
Thanks!
Cheers
St


