


Stock Trading Alert originally published on March 14, 2016, 7:31 AM:
Briefly: In our opinion, speculative short positions are favored (with stop-loss at 2,050, and profit target at 1,900, S&P 500 index).
Our intraday outlook is bearish, and our short-term outlook is bearish, as we expect a downward correction or short-term uptrend's reversal at some point. Our medium-term outlook remains bearish, as the S&P 500 index extends its lower highs, lower lows sequence. We decided to change our long-term outlook to neutral recently, following a move down below medium-term lows:
Intraday outlook (next 24 hours): bearish
Short-term outlook (next 1-2 weeks): bearish
Medium-term outlook (next 1-3 months): bearish
Long-term outlook (next year): neutral
The main U.S. stock market indexes gained between 1.3% and 1.7% on Friday, extending their recent move up, as investors reacted to economic data releases, oil prices advance, among others. The S&P 500 index broke above its resistance level at around 2,000, following last week's short-term consolidation. The next important level of resistance is at around 2,040, marked by the early January daily gap down of 2,038.20-2,043.62. On the other hand, support level is at 1,960-1,980, marked by previous level of resistance. There have been no confirmed negative signals so far. However, we can see some technical overbought conditions. Is this a new uptrend leading to last year's all-time high or still just an upward correction following January sell-off? The S&P 500 continues its short-term uptrend so far, as we can see on the daily chart:

Expectations before the opening of today's trading session are virtually flat, with index futures currently down 0.1%. The European stock market indexes have gained 0.6-1.5% so far. Investors will wait for series of economic data announcements later this week, including Wednesday's FOMC's Federal Funds Rate decision release. The S&P 500 futures contract trades within a relatively narrow intraday consolidation, as it fluctuates along the level of 2,005-2,010. For now, it looks like a flat correction following recent move up. The nearest important level of support remains at around 2,000. Will it extend its short-term uptrend?

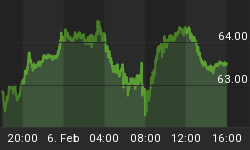
The technology Nasdaq 100 futures contract trades within a similar intraday consolidation, as it fluctuates along the level of 4,340. The nearest important level of support is at around 4,300-4,320, marked by some previous local highs. The nearest important level of resistance is at around 4,350-4,360. For now, it looks like a relatively flat correction within a short-term uptrend, as the 15-minute chart shows:

Concluding, the broad stock market extended its short-term rally on Friday, as the S&P 500 index broke above resistance level of 2,000-2,010. Will it continue towards last year's medium-term highs above the level of 2,100? There have been no confirmed short-term negative signals so far. However, we continue to maintain our speculative short position (opened on March 7th at 1,995, S&P 500 index). We expect a downward correction or uptrend reversal at some point. Stop-loss level is at 2,050, marked by the above-mentioned daily gap down resistance level, and potential profit target is at 1,900 (S&P 500 index). You can trade S&P 500 index using futures contracts (S&P 500 futures contract - SP, E-mini S&P 500 futures contract - ES) or an ETF like the SPDR S&P 500 ETF - SPY. It is always important to set some exit price level in case some events cause the price to move in the unlikely direction. Having safety measures in place helps limit potential losses while letting the gains grow.
Thank you.


