


Over the last year we transitioned from the stock market angst of 2015 to the bullish breakout of 2016. For NFTRH, the real proof in the pudding was the ramp up in the cyclical Semiconductor sector's Equipment sub-segment (Applied Materials, Lam Research and the like). Specifically, we tracked a trend in Equipment orders and projected a bullish Semi sector a year ago. The logical extension of this was a bullish stock market, since the Semis are a leader.
What a difference a year makes. Reference AMAT Chirps, B2B Ramps, Yellen Hawks and Gold's Fundamentals Erode from last May. Our best target for the SOX index was around 940 and late-arriving momentum players (and their 'quant' machines) have driven the index beyond reason of late, to a high of 1017 last month. It is time for a cool down in this leader; potentially a real deep freeze because it has been running way too hot.
Always looking ahead, and only looking behind for frames of reference, we see that some macro signals are shifting beneath conventional market participants' feet. First, as I began clubbing people over the head with in January, the Treasury bond market was set up to catch everyone off guard. Who called the bottom in bonds? Why, none other than media star Louise Yamada and Bloomberg with the headline R.I.P. Bond Bull as Charts Say Last Gasps Have Been Taken. All of this hysteria because Louise knew how to draw a single line on a chart of the 10 year yield.
"Prices of bonds are going to go down and you are going to lose your capital," said Yamada, who began her technical forecasting career at Smith Barney under mentor Alan Shaw.
Here was my response from a post called, ironically enough, R.I.P. Bond Bull!!!!! on December 16...
But let's take it further and draw a different trend line than Yamada's; let's make a post-1986 trend line and then add a parallel lower line to form a trend channel. Taking another step further, let's note that the high set on the late 2013 GREAT ROTATION!!! (out of bonds and into stocks) hype in the financial media exactly 3 years ago is the decision point on a new trend, and that happens to more or less coincide with the upper channel line.
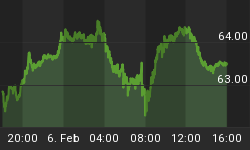
But first things first, TNX has not even broken the moving average yet (it is 2.69% vs. a current yield of 2.58%).
Here is the updated chart. All the 10yr yield has done is decline since the big proclamation about rising yields (declining bonds). This was 100% in line with the contrarian setup for bonds as the Yamada/Bloomberg media complex unwittingly marked the bottom in bonds, almost to the day.

But the above is a digression from the points I want to make in this post. Those points are that certain indicators of general market risk are rising and at the same time, these indicators could point to a coming counter-cyclical atmosphere (if the fledgling breakouts shown below go on to higher levels and new trends). Let's begin, aptly enough, with Treasury bonds.
The long-term Treasury bond fund (TLT) is finally (I did have to exercise a lot of patience, although the steady dividend income helped) breaking out from a double bottom. The target is the declining 200 day moving average. This is a bounce only for this risk 'off' item, and we are not necessarily bearish on the stock market beyond the current correction.

But here is where it gets interesting for gold. Anything look familiar to you? This is exactly the reason we talk about tuning out inflationist gold bugs and tuning in to the reality that the gold sector is counter-cyclical. Think of it this way, TLT above would not be rising in an inflationary environment. No, it rises with counter-cylical and/or deflationary forces. Gold vs. SPX (GLD-SPY) below does the same thing.

It is for this reason that we harp on the 'Macrocosm' as the driver of the counter-cyclical gold sector's real fundamentals. What's the biggest planet? Why, Gold-SPX above.

Now, if TLT is only indicated to be on a bounce to its declining SMA 200, so too likely is gold vs. the stock market.
Folks, we are on a macro shift and bounce right now but changing the macro for real is going to take a lot of time, and successful management of these changes is going to take a lot of flexibility and on-the-go analysis. Commit to remaining aware of what is on a bounce, what is on a trend and what it would take to put all these elements into a blender and change current trends. Commit to working at it, because one day when the macro pivots and changes for real, it will have been well worth it.
I am being purposefully vague with conclusions because those conclusions can only be made through the details we work at every week in NFTRH. Putting out set-in-stone conclusions in this atmosphere could do more harm than good because the markets are in motion and often contradictory from one time frame to another. It takes management. Manage.
Subscribe to NFTRH Premium for your 40-55 page weekly report, interim updates and NFTRH+ chart and trade ideas or the free eLetter for an introduction to our work. Or simply keep up to date with plenty of public content at NFTRH.com and Biiwii.com. Also, you can follow via Twitter @BiiwiiNFTRH, StockTwits, RSS or sign up to receive posts directly by email (right sidebar).


