


September, 2006
9/18/06 - Dow/Gold Ratio, etc.
On the front page of the website currently resides a chart of the Dow/Gold Ratio. I put it there for personal reassurance in the face of short-term difficulties for my portfolio stance over the last 1.5 weeks and also to lend a calm image to anyone who may be affected by the hype-fueled financial media that makes [paraphrased] claims like "oil can't keep gold up", "gold is a commodity and commodities are going down" and "we have just the right amount of growth in the economy, the Fed's in control". Here is another view of this important chart projecting the counter-trend rebound in Dow units to end in the 20-23 ounces of gold range.

I look around various dens on the web and I find bears exhibiting extreme agony at the moment: The PPT has really exposed its farcical modus operandi as it props UST bond paper/stocks and hammers commodities. Another script reads something like this: "Honest money" is being manipulated by coordinated central bank sales in the lead up to the elections. I am not going to comment on the levels of validity to these assertions because I simply do not know the answers. All I do know is that the chart says stocks became deeply oversold when measured in their ON-GOING bear market to gold. It's a technical thing. The target is getting close for things to reverse back to the primary trend (stocks will continue to be bearish when measured in gold). This will not happen over night however. Markets work in an ongoing process and that is why charts are a must for daily, weekly and monthly check-ups on trends.
Daily I read and hear commodity/energy bulls holding their bullish line for the long run, which makes me wonder whether our 290 target for the CRB's ultimate bottom may not hold. The majority of these bulls do not discriminate gold from other "resources". I do. We are in a contraction or more accurately a much needed (and predictable) breather in the inflation economy whereby the Fed gets the herd into the "proper" assets (US Treasury debt first and foremost) before trying to reflate the economy. But that is getting ahead of ourselves. There is still more talk in the mainstream about high oil prices than there is of its decline. The masses will need to be begging or demanding the Fed drop rates. That will be gold's real trigger; public sentiment that in essence says "give us inflation or give us death!". The Fed will try to oblige as they have been doing throughout the decades.
Deflationists say that the Fed will be powerless to stem the tide of a rush to cash and debt-repudiation once it gets rolling, ignited by a real estate market that is currently rolling over. To be sure this is a dangerous time and I am convinced that it is not so easy for the Fed as each contraction-reflation bubble cycle becomes more levered and dangerous than the one that preceded it. But this only adds to the case for gold. We can have deflation and inflation at the same time, whereby massive amounts of capital is fleeing the asset markets in repudiation of sublime (and un-payable on a macro level) amounts of debt while the Fed and global central banks "push on a string" and make their intrinsically worthless paper available to every last would-be bubble participant who wants to play into the wee hours in the casino. If we are to have another growth phase after the current retrenchment plays out, I expect gold to be well out in front of stocks and a few months in front of general commodities, just as it was in 2001. If the Fed fails here in its business-as-usual, gold will be the asset (other than cash for short term liquidity) for an environment of chronic and unstoppable economic contraction (even as the Fed tries to stimulate growth) - in my opinion given a lifetime of non-stop money supply inflation.
As mentioned previously, if the asset class for the current macroeconomic backdrop were little green men from Mars, I would find a way to chart them and gain entry into this would-be hot market. I do not worship at a golden alter as it seems some in the sector do. I am just trying to get through challenging times on the right side of the trade.
The above is the most recent entry in the Biiwii Letter which is currently available for your review free of charge and soon by subscription access. Check it out and send feedback to info AT biiwii.com.
9/15/06 - Oil & Gold
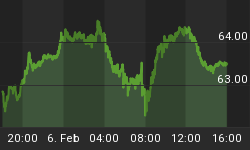
Speaking of oil, here is an article from Bloomberg Gold Prices Fall in NY on Speculation Demand Will Slump. From the article: "A decline in oil helped send gold lower. Oil futures touched $63.15 today, the lowest since March 23. Prices are down 2.9 percent from a year ago after reaching a record high of $78.40 on July 14. Gold and oil have generally moved in lockstep as investors buy the metal as a hedge against inflation when energy expenses climb. Oil erased earlier gains after the Energy Department said inventories are 11.7 percent higher than the five-year average." With this tidbit from a Mr. Frank Lesh of something called FuturePath Trading: "Crude has to do better than this to pull the metals up".
That quote is a fine example of why it is advisable to filter everything you read or hear in the mainstream financial media. As I have often cracked on the blog, "retardation is not a sound investment strategy". Once again, inflation is not high prices just as deflation is not low prices, yet we hear all the time things like "there is widespread inflation in oil and energy" or "the real estate bubble is popping and there will be deflation in the housing sector" but in reality those are just the effects of monetary policy, with lags built in. Inflation is rising money supply from various liquidity aggregates and deflation is a decline in available money aggregates. The oil price is a result of inflation policy so how on earth can it be a driver of the gold price? Answer: Trader sentiment in the short term and no linkage in the long term.
One soundly invests / trades in the gold sector because there are deeply fundamental reasons to do so as global central banks expand their money supplies at will, subject to periodic deflationary (money supply tightening, at least the appearance of such) episodes - like now. As you may know, I have been concerned about gold being just another speculation as it lagged, caught up to and eventually outperformed garden variety commodities. Also, the barbarous relic running in lockstep with the helium filled stock market? Something was not right and many misperceptions had room to run. Misperceptions like the above "crude has to do better than this to pull the metals up".
So for now, I will personally let the Dow / Gold ratio reset itself from deeply oversold and with it a short term visit from Goldilocks. Hysterics will play out as the dreaded "commodity bulls" die by the same sword they lived by - dragging gold down with them - and we'll wait out the yield curve bottoming process and stay focused on the big picture. I tend not to ride corrections all the way down and fully loaded so short-term losses are within acceptable limits, but as you know I have advised risk management steps be taken over the last few months and by taking my own advice, I have a high proportion of cash with which to take advantage. This is the part where the people who know why they are bullish a particular asset welcome an opportunity and those who were caught up in the mania (and watch indicators like the oil price) will only sleep well after they sell and get it over with. It is always this way.
9/14/06 - Crude Oil, etc.
In keeping with the theme that the Fed absolutely had to have commodities under control we now look at crude oil, the most visible and headline hogging of all the commodities. We have chronicled the breaking of the commodity complex since it's first "lower high". Crude is now under control as well:

The uptrend from 2003 is gone and next in sight is the trend from 2001, pending any counter-trend bounces to test the initial breakdown. I doubt oil will decline much below $57 per barrel, but if it does it is a long way down to the 37 - 40 range. Why do I doubt the ultimate Goldilocks scenario? Because as I have been writing since 2004, this is an inflation economy where it is all monetized; oil, materials, real estate and so forth. It is all part of the way that the global economy, with the US inflation machine its engine, runs. Money is created out of thin air and that is the number one global macro fundamental; liquidity from non-productive sources runs the show. In other words, rising asset prices are part of the cost of doing business and the Fed's business is inflation; inflation of the money supply. The "game plan" is and has been deflationary "whiff" or scare (in progress) which gets the bond herd on the correct side of the boat (check) followed by policy makers being able to point to highly visible and economically sensitive commodities and real estate as proof that inflation is not a problem. Then, voila, more inflationary policy to the rescue. I would expect headlines over the next 6 months that get people's attention on anything but inflation. Perfect. Fly in the ointment? The stock market. Contrary to what a lot of people believe, I think the market is rising on hope, dreams of Goldilocks and massive hedge fund rotation. There is the election cycle paranoia, PPT as bubble inflator angle, but at this point I have got to believe Bernanke would rather see the market break to join the deflation scare party. Maybe not. Maybe it is only things of real value that the Fed wants broken knowing that when paper things like the USD or the US stock market let out some air it is an ill wind indeed. The idea of the "next bubble" being another stock bubble bears watching.
So when the Fed monetizes, we want to know where the disembodied, hot money will flow. Back into gold first and foremost is my take. Then the resource sectors and finally the stock market. Saddled with debt overhang, the real estate market may be out of commission for the foreseeable future. I will also note that something quite peculiar is happening right now; US manufacturing remains alive and well. I would love to see a spin toward a new bubble in actual productivity in this country.
9/13/06 - Goldilocks
Okay gold bugs, what we have here is Goldilocks come to town. The story is spreading in the mainstream and it will likely stick around long enough for the Dow/Gold ratio (see chart on "Home" page) to reset itself from severely oversold conditions. I have previously noted that there were many bearish divergences in the markets but that the nagging bullish indicator was that the public was incredibly bearish. How often is the public right? Well, Joe Sixpack's record is no longer in danger of being broken; he's wrong again. Here is something I posted on the blog on August 16th:
Do you remember I mentioned that everything was falling into place for a bearish stance on the market with one nagging exception? That being the public's downright bearishness? Well not only did Joe 6's bearishness put a safety net under the pig, but it proved to be downright bullish in the short term. Well, you know Joe. He is going to start questioning himself now. He is sidelines in CD's and money markets, where he should be. But Joe has more important things to see to than looking too deeply into macroeconomics. Joe is hearing Wall St's song of the paused Fed and it sounds good to him. The markets have higher to go now short term IMO, and they may head for the cyclical bull market highs - with Joe on board! Final piece of the bearish puzzle solved.
It is true that I have gone bearish in the short term but if I were good enough to predict the exact moment this mess will unravel, well you know I would own my own tropical island, have my favorite rock bands flying in to play for me and be trading on a laptop on the beach (not caring how many options trades I blow ![]() ). So, my crystal ball is really just made of glass and in it I see commodities topped out (here is the August 17th chart from the blog where it was first red flagged)...
). So, my crystal ball is really just made of glass and in it I see commodities topped out (here is the August 17th chart from the blog where it was first red flagged)...

...gold getting taken along for the ride (something I expected but for fundamental reasons I have decided to endure - this time), a really bullish SOX chart down there helping signal that slap-happy technology bulls have some room to stretch their legs, a yield curve quietly attempting to form a major bottom, a real estate market unwinding, national and public debt so extreme it will never be effectively serviced...and so on with the fundamentally bearish macro. I will also note that I find it perfectly sensible to be bearish while allowing for the possibility that Goldilocks will mutate into something even more absurd; a downright spectacular stock bubble. Meet the new bubble, same as the old bubble. If manipulative forces are as extreme as some think, with Bernanke and Paulson flying the markets on remote control, then the sky is the limit given the fragile psyche of the good old US of A. I believe they are gamers extraordinaire, but I do not believe they are running the show. More likely, and scarily it is a major "foundation" of the global economy that is running the Goldilocks theme; the massive hedge fund community. Rotation into the anti-inflation trade. The early adopters saw indicators like the SOX bottom and went with it. The public will be brought into the fold, commodities will indeed remain down for some time and gold will bottom. I don't expect this to be a long running process however. In the meantime, stocks are good, gold is just a commodity and the macro mindset is in the process of going schizoidally from inflation fears to contraction/recession/deflation fears, just as I have been noting in my script all along. We will do well to remember that the Fed desperately needed the herds on this side of the boat. They are fighting for standing room on the starboard side!
9/12/06 - SOX
While waiting through the bloodbath in my absolute favorite sector (Gold - given current macroeconomic fundamentals) I thought I would present something from a sector that actually looks bullish. As you know, I remain bearish on the broad market for the short term given its numerous negative divergences, but considering the 4 year cycle bottom everyone is anticipating, we might give some weight to the idea that some sectors have already bottomed. The Semi's, a leading technology sector, could be one.

That looks an awful lot like a short term bottoming pattern and in fact it could be an inverted H&S which may have already pierced its neckline, depending on where one draws the line. If this pattern is viable, the near term target on the SOX is in the 500 to 520 range. I am not suggesting to run out and buy semiconductor and tech stocks. I am not currently doing so. At the least I will personally wait for some sort of retest of the lows. It is entirely possible this is just a result of hot money gaming its way into the flavor of the day. But I wanted to post the chart of this leading tech index so that heavily bearish people may consider its implications. Here is the blog post from August where it was noted that the SOX was up to something.
9/11/06 - HUI H&S?
We note that the head & shoulders top scenario is potentially back in play on the gold indices. If so, it is a sloppy looking H&S to say the least, but would project the indices back to near the May '05 lows as noted previously on the Blog. I don't believe this is what is happening, but as I have said repeatedly "stocks are stocks". Given their big-picture fundamentals, I would only see something drastic happening to the miners if there were a major broad stock market event.
9/11/06 - Gold vs. Copper
With the commodity complex declining, oil and base metals down and precious metals looking to get walloped today, it is appropriate to continue watching for signs of gold's out-performance relative to industrial or economically positively correlated metals. A popular indicator is the gold-silver ratio. When gold asserts a strong uptrend vs. silver, we are likely to be confirming an economic contraction environment. But I thought I would post a chart of gold vs. last year's star industrial metal, copper. A double bottom could be forming here and if it is, one might consider it an indicator of a double top in the prognosis for a healthy, growing economy going forward.

9/10/06 - Gold Angst
There appears to be a lot of stress building among the gold bugs. That is because a lot of gold bugs added to the mix over the last few years are apparently the animal commonly known as the raging commodity bull. Let us just say that I am not one of those, as I have noted over and over on the Blog this summer. Here is a hint of where I think commodities and energy are headed in the short to possibly intermediate term; I did not pre-pay any of this year's heating oil. Also, I am not afraid to hold cash and short term treasuries with very acceptable yields. The predictable deflation event is in progress and the spooky deflation proponents are out in full force. The 10 year shows inflation not to be a problem and indeed the 3 month T-bill (noted in red) is signaling that the Fed is done on the upside. If you pull a chart of the $IRX itself, you will note it has soundly broken through the 50 day moving average. If this condition persists we will take note of the similarity to late 2000, just before gold's major bottom. What the gaming inflation trade misses is that gold wants contraction, not expansion. That is because it will be the one asset looking far enough ahead to see dollar-eroding inflationary liquidity out on the horizon. Meanwhile, a lot of dissonant noise surrounds the barbarous relic. That is bullish beyond the near term. Will the support noted on the chart hold? It looks like a nice technical point. But with the metal itself, it is really not about its short term price is it? One might do well to think a little more ahead and realize it is more about insurance against unsound monetary policy in the future.

9/9/06 - 10 Year, Another View
Here is a Blog post from June showing the rate situation from a different angle. Again, today's environment is definitely NOT a surprise. Click the chart, see the game plan that has been in the works for some time.
9/9/06 - 10 Year Big Picture
Just to get the letter's analysis started, I thought it would be appropriate to review our long-standing take on the Treasury market. I would like to present old friend the Andrews Fork on 10 year rates, which I have been watching for months now in its big picture monthly view. As you can see, our target of 4.6% to 4.8% has arrived. Here is a post I made on the Blog when 10 year rates were over 5%. This drop in rates is and has been all part of the script. A deflation scare, at the least, was always in the cards. Now we find out if that is all it will be. The current chart shows not much room left to the downside:

9/8/06 - Introducing the Biiwii Letter
I would like to introduce you to our premium content service, The Biiwii Letter. In the next few weeks this section will be password protected and accessible through a simple Pay-Pal subscription transaction of $14 per month. Other payment methods may be arranged as well. Analysis and market opinions are currently presented in an informal manner on the Notes & Charts Blog to give you an idea of how I operate. The content of this letter will be an expansion of that, perhaps without some of the wise-guy cracks but with a more in-depth presentation of what I consider to be sensible portfolios styled for economic realities, concepts in sound money, technical analysis of various markets and asset classes, macroeconomic commentary and yes, even the occasional trade idea (I like to have a little fun now and again as I travel the long road to financial sense-making). But we always manage risk first, and then look to increase capital. Balance is an important word. This is not a stock pick or gambling site.
I believe we are witnessing a rare and interesting stage in the global economy and by extension, the markets. A lot of assumptions are being tossed around like grenades and it is these assumptions that people's investment portfolios will live and die by. As an example, with the housing market rolling over for all to see, the "deflationists" have predictably come out of their bunkers and they are lobbing bombs. "Sell everything!" they say. "It's all going down". But others, this writer included, have been awaiting this event for some time now and what ultimately proves with hindsight to have been the right course of action may have more texture and nuance than a tact that simply says "go 100% cash and await the bargains".
I am and have been bearish on commodities for months now as you know if you have read the Blog. Longer term I am bullish because longer term I am bullish on the willingness of global policy makers to do what's wrong for their paper currencies in the interest of short term gains and keeping up appearances. Where a lot of the deflationists get confused is in their definition of deflation. There is an article out this week by a fellow confidently telling all who read to sell everything, precious metals included because "asset deflation" is coming. The problem here is that there is no such thing as asset deflation. Inflation and deflation are money events. If more money gets created there is more money and by definition INFLATION of the money supply. Find some of Steve Saville's archives about deflation on the popular article sites. He has done a lot of good work on the subject.
Here is the year-to-date status of my portfolios as of 9/8/06 relative to major indices. I have been dinged pretty good this week, but fortunately one week does not success or failure make.
Biiwii Actively Managed Portfolio +23.31%
"Trading" Account +52.35%
S&P 500 +3.66%
Dow 30 +5.73%
Nas Comp -2.27%
Trannies +.67%
Ute's +7.29%
XOI Oil +12.71%
XAU Gold & Silver +13.21%
SOX Semi's -9.16%
I am not a day trader or even a really sharp trader. I do well performance-wise (considering safety is always my primary consideration), but I am by no means a stock guru. What I am is somebody who can generally pick good entry points (using TA) that are in alignment with how I see the macroeconomic backdrop. I keep watch lists at all times and rotate the portfolios. Profit taking IS allowed! But I try to have other good ideas ready for investment, even if that idea is something as simple and unexciting as rotating out of the Templeton Global Income Fund after an 8% increase in NAV along with several dividends and into the iShares 1-3 year US Treasury Fund, given that the anti-dollar trade was looking a bit long in the tooth. That's an example. Rotation, rebalancing, but not trading for the sake of trading. I plan to regularly post the composition of my portfolios with approximate percentages of the various asset classes. As noted, I am having a tough week this week. But balance in the ports is ensuring there is a limit to the pain I can suffer as I wait out technical and fundamental signals. This is a must for me. If you want a hero or guru, you might look elsewhere.
A couple other points; for me, all paper is a trade. As long as paper instruments are backed by the full faith and credit of chronic global inflators, it can only be that way. Some trades can last years while others maybe only a few days or weeks. Things of value, like actually owning what you own through debt elimination, real productivity as opposed to the levered kind, hard assets and precious metals will also be discussed here. There is much more to the picture than the stocks and bonds that the conventional financial services industry is pitching. That said, there are times when some measure of value may be found there as well, especially when the public is convinced otherwise. Did I mention I am a contrary sort by nature? ![]()
If you are interested, please take some time to visit the About & Terms page. There you can review past articles dating back to mid-2004 and also review our Terms & Conditions. The Blog will also give you a good idea of how I use macro-fundamentals and technical analysis. I have decided to have the Letter posted to the website instead of being sent out by email because this will allow for updates as dictated by market events. It may be less structured but more free-flowing and in tune. Monthly archives will be kept on this page in the form PDF documents.
Thank you for reading and I look forward to providing a quality service to subscribers. Amidst the noise, I hope this Letter will provide a calm, sensible way station for your consideration. It is what it is.
Contact with comments, questions or just to say hi!
Sincerely,


