


The following is an excerpt from commentary that originally appeared at Treasure Chests for the benefit of subscribers on Tuesday, October 30th, 2007.
Soon, the falling US Dollar ($) will reach a point of maximum pain, where trading partners will be forced to print enough currency to absorb accelerating quantities of $'s or have their currencies soar further against American fiat. Known by many as the 'race to zero' all fiat currency systems undergo in their latter stages, and based on the observation the $ has now signaled it's in crash mode, one should expect this process to accelerate as essentially what is occurring is US debt holders are being bailed out. What's happening is the market knows they can't pay, and therefore the need to inflate debts away has now gripped macro-conditions. So, Americans are being pampered right now because they are still viewed as 'key' in global consumption trends, but make no mistake about it, with the exception of newfound wealth in emerging markets, US trading partners are also seeing the consequences of unmanageable debt burdens, which will foster the need for competitive currency devaluations as process unfolds in coming months and years. This is what a parabolic gold price is signaling, the need for speed in currency debasement protocol on a global basis, or as is commonly referred to, 'competitive devaluations'.
So, the question then arises, 'is the situation in the States really that much worse than abroad sufficiently to justify further acceleration in debasement rates of the $'? You know what, the answer to that question is probably 'yes', where the dichotomy between tighter lending standards set against even greater credit needs to keep asset bubbles (the economy) afloat is in full collision mode. How can you have tighter lending standards and maintain a credit bubble? Answer: You can't. Add to this the first baby boomer was paid his first social security payment last week, signally the demographic bell curve is accelerating to the right now (meaning the population is getting older and will be less eager to borrow money) and it's not difficult to conjure images of a credit bubble in the process of imploding. Oh yes, and then there's the real estate market, and all those mortgages increasing numbers of people will be unable to afford. Did you know that to date only 1 percent of Adjustable Rate Mortgages (ARM's) have been refinanced in the States? Why? Answer: Because with tighter credit standards these people simply don't qualify for conventional mortgages. Remember now, this is the stuff all those CDO's banks are attempting to transfer to the taxpayer are comprised. And if most recent changes in the ABX Indices are any indication, even AAA credit won't qualify for a loan pretty soon because although you are not allowed to state this view on bubble-vision and expect to keep your job, America is in recession. But shhh - keep it quite and maybe we'll be able to fool everybody so they don't start pulling their money out of the States. That would crash the $ as opposed to the devaluation being imposed on the world right now.
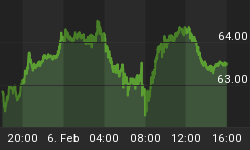
Behind the scenes the Fed is all too aware the economy is in recession. They know this because financial institutions are showing up at the Discount Window needing emergency loans more than ever these days. This is of course not a surprise to us as we have been tracking the ABX Indices and know liquidity is still a problem out there, along with the rising gold price naturally, discounting the need for more speed in monetary debasement rates. And now we might also be able to add the Yen to the list of indicators in this respect. As you can see below the Yen is threatening to break higher in a continuation pattern, which would signal global players are de-leveraging via a reversal in the Yen Carry Trade. This would mean they see worsening prospects for growth on a global scale, which would undoubtedly play havoc with all equity groups, not the least of which would include emerging markets (BRIC counties) and commodities as the perception globalization trends are played out takes hold. (See Figure 1)
Figure 1

One does have to wonder what silver making a run up against gold means this time around however. Is this a hyperinflation signal, where monetary authorities will make up for faltering credit conditions by monetizing everything in sight? After all, that's exactly what they are doing right now. So, a breakout in the Silver / Gold Ratio is more than likely a hyperinflation signal this time around more than an indication economies are strengthening in my opinion, which of course is consistent with the thesis presented above. Again however, what is disturbing regarding the future is the observation the Yen is poised to break higher, which of course calls into question the continued health of the larger credit cycle, asset bubbles, and perhaps even the ability of governments to inflate their money supplies further. You see in theory the idea behind an accelerating inflation agenda such as the one being perpetuated on us right now is that if debt has the consumer down, it's the government's job to inflate it away. And again, this is exactly what they are attempting to do at present.
The only problem is it's not working. The inflation is not benefiting those that need it most, as most people are not invested in the assets that are inflating, that being the stock market. Moreover, what's happening is most people who are in trouble, which is now extending well into 'middle America' due to collapsing / stagnating real estate values, are being hurt even further by rapidly rising prices that are eating into diminishing real incomes at an accelerating rate. The only exceptions to this condition are the top 3-percent or so who still own things free and clear. Everybody else is being consumed by rising prices and debt, which is a big problem I can assure you, as this condition will not go away anytime soon. How do I know this? In addition to collapsing ABX Indices across the board now discussed above, it should be noted the depreciating $ is not raising stock prices like it use to, where this most recent decline is set against a divergent S&P 500 (SPX) unable to make new highs. This can be seen below, along with the very tight relationship US tech stocks have formed with a declining $, as measured by the NASDAQ 100 reverse fund ProShares Ultra Short QQQ ETF. (See Figure 2)
Figure 2

As you can see above then, what is happening is US tech stocks have become dependent on a falling $, a trend firmly established since the beginning of the year. Again however, for the first time since this tight correlation was established, fresh lows in the $ have not been accompanied by new highs in the broad stock market (SPX) primarily because banks and financials have broken trend (as observed last week), and they still comprise in excess of 20-percent of the market weighted capitalization of the SPX. So, what does this mean? In a nutshell it means we can expect to see increasingly drastic measures out of the Fed to protect the bubble economy (financial institutions - which is the Fed's true mandate), which means one should not be surprised to see a half point rate cut this Wednesday given what is happening. This in turn would have the effect of punching the $ even lower, where as pointed out by Dave a few weeks back, if the 76 level is taken out on the downside, a crash into the 72 area is not out of the question. Based on the fact financial institutions in the States appear to be increasingly stressed in spite of the extreme measures already taken, it appears even more extreme measures need be implemented at this time, considerably raising the probability the above scenario will become a reality.
What if the Fed only cuts a quarter-point from the Fed Funds Rate on Wednesday? Here, even if they cut the Discount Rate a half-point again, I would expect to see the $ repel higher from current levels to test the break at 80. At this point however, based on the way domestic stock markets are performing in the States right now, if the Fed is determined to avoid deflation, it will cut the rate to consumers (Fed Funds Rate) by a half on Wednesday, or both the $ and stock markets will swing into counter-trend corrections, and scare the bejeebers out of everybody in the process, as it would be perceived they are out of touch with reality, whatever that means today. Further to this, if the half-point rate cut does come, expect to see a healthy Employment Report on Friday to buffet the $'s decline, creating some volatility in the trade. This shouldn't last long however, as if the 76 level on the $ is taken out, a signal a continued accelerated decline will have been triggered, where a bounce off the 72 area would perhaps generate a reaction back up to the 75 level, locking traders into a bull trap in terms of current proximities. This is the message in this next chart, where even if we do see a bounce in the $ to test the break at 80 in coming days, the prognosis is still for a crash, one way or the other. (See Figure 3)
Figure 3

And in returning to Figure 2 above for just a minute, based on the appearance of the stochastic indicator presented in this chart, again, it's not difficult envisioning a $ rally soon, where whether further extremes are seen this week or not, blow-offs in hot stocks, commodities, and currencies, including gold of course, have assuredly reached a degree of frothiness not witnessed in some time. Again, in my opinion, this will depend on whether the Fed goes 25 or 50-beeps this week, where only a 25-point decrease in the Fed Funds Rate would spark such a rally in spite of the fact a cut was provided, being insufficient in nature. Here, further evidence is provided more stringent measures are necessary by looking at a plot of margin debt for the New York Stock Exchange (NYSE), presented below. As you can see here, it does appear we have reached a peak, and that although more sideways action in coming months would not be out of character, the next move of consequence will be down - and down hard, just like in 2000. In this respect, 2008 is shaping up to look much like the year 2000 in both being election years accented by crisis in preceding years, along with similar but exponentially growing policy responses. Or in other words, monetary authorities are inflating with abandon at present, but for one reason or another (likely speculator exhaustion), stocks appear set to top at some point in coming days again, at which time they will likely commence a multi-year bear market. (See Figure 4)
Figure 4
Source: Investmenttools.com
In the meantime however, it should be accelerating levels of currency debasement will make up a failing credit cycle, and that record high short positions in stocks will continue to get squeezed out. How can we tell just how strong a move this will be? In answering this question I will employ two charts to aid me, the first being the brightly colored gold chart shown last week in talking about a likely move to $800; and also, a plot of the NASDAQ 100 (NDX) / DOW (INDU) Ratio that shows tech stock leadership in the stock market is potentially set to reverse after one more party associated with tomorrow's Fed announcement. First to the gold chart however, demonstrating that once the large round number at $800 is taken out, a move to $1,000 appears in the cards according to Mother Nature. What's this - how can we state such an outcome appears destiny in nature? Answer: Because Fibonacci progressions are in fact measures harmonious with nature, and since price movements in markets are based on human nature, where when under stress we return to our primal nature, prices trend to gravitate to Fibonacci targets when extremes in emotion bring out these tendencies in us. Hence, if the Fed cuts rates by a half point tomorrow, gold could blow right through $800 on its way to $1,000 in short order as fear the economy is so bad such a measure was necessary takes hold. This would of course be the circumstance that accelerates the $ crash as well. (See Figure 5)
Figure 5
Unfortunately we cannot carry on past this point, as the remainder of this analysis is reserved for our subscribers. However, if the above is an indication of the type of analysis you are looking for, we invite you to visit our newly improved web site and discover more about how our service can help you in not only this regard, but on higher level aid you in achieving your financial goals. For your information, our newly reconstructed site includes such improvements as automated subscriptions, improvements to trend identifying / professionally annotated charts, to the more detailed quote pages exclusively designed for independent investors who like to stay on top of things. Here, in addition to improving our advisory service, our aim is to also provide a resource center, one where you have access to well presented 'key' information concerning the markets we cover.
On top of this, and in relation to identifying value based opportunities in the energy, base metals, and precious metals sectors, all of which should benefit handsomely as increasing numbers of investors recognize their present investments are not keeping pace with actual inflation, we are currently covering 71 stocks (and growing) within our portfolios. And more recently we have been focusing on the Red Lake gold camp, hosting some very interesting emerging opportunities. In this regard I have just returned from a due diligence trip and will be providing a report to subscribers later this week. This is another good reason to drop by and check us out.
And if you have any questions, comments, or criticisms regarding the above, please feel free to drop us a line. We very much enjoy hearing from you on these matters.
Good investing all.


