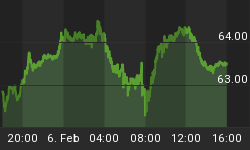
Last week's large decline in equities was largely attributed to new evidence of collateralized debt obligations (CDOs) losses faced by major banks. The size of total future write-downs is now speculated to range anywhere between $150 billion to $500 billion.
But the most severe action came on the NASDAQ 100, which fell by over 7% in just three days (8.1% for the week); the biggest such decline since August 2002. This is compared to just 4% (3% for the week) on the Philadelphia Banking Index (BKX), which actually stabilized on Thursday and Friday as the tech stocks plummeted.

What is going on? In our opinion, the banking problems are old news. What is new is the significant strength of the Japanese yen. The yen has now reached an 18-month high against the US dollar, a level which caused serious yen carry trade unwinding in May 2006.
The yen is actually rising against almost every major currency. The highly leveraged market participants (who have borrowed tremendous amounts of cheap funds in Japan) have already significantly reduced their exposure to the financial sector in August and September. Instead they have made their bets on NASDAQ 100 companies, which were viewed as beneficiaries of the weaker dollar.
Last week's rise of over 3.3% in the yen is causing another round of unwinding, pressuring the leveraged players to sell their positions to avoid margin calls.

It seems that the major driving force behind the equity markets is not earnings or technical conditions, but the yen's exchange rate against the dollar and the euro. If the upward move in the yen continues, the equity market is unlikely to stabilize at current levels. If on the other hand, the yen forms a double-top formation on the chart above, the equity markets will undoubtedly be poised for at least a short term rebound.
Already, we are seeing something exceptional - the strength of precious metals despite the yen's surge. This is exactly the opposite of what happened in May 2006 and August 2007. This time may indeed be different! Gold is rising in all major currencies and silver has finally joined gold by hitting a new high.

It appears that not only precious metals but also gold and silver related equities are starting to be viewed as alternative or safe haven investments. The chart below clearly illustrates that the Gold Bugs Index (HUI) outperformed NASDAQ 100 Index by 34% since August 2007 and the S&P 500 by as much as 50%.

This demonstrates the strength of precious metals and related equities during a general market downturn, an unusual occurrence in the last three years, but highly common over longer periods of time. Are gold, silver and related equities finally decoupling from the rest of the equity market?
At this point, a correction in gold stocks is possible, but we believe it will be both shallow and short lived. One of the reasons for this is that the fear of a severe correction remains at an elevated level among investors - a positive contrarian sign.
In addition, the small cap gold and silver stocks are only beginning to head north. Being less liquid, having a higher perceived risk, but also better value; they almost always rally dramatically in the later stages of the sector upturn. Our tactic remains unchanged since six months ago: hold your positions and buy undervalued small-mid cap gold/silver equities on any weakness.


