"No warning can save people determined to grow suddenly rich" - Lord Overstone
 |
Gold •726 days | 2,368.70 | +35.30 | +1.51% |
 |
Platinum •15 mins | 1,569.40 | -22.90 | -1.44% |
|
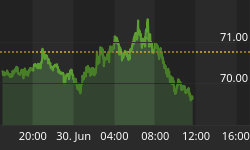
WTI Crude •11 mins | 69.84 | -0.91 | -1.29% |
|
Gasoline •56 mins | 3.053 | -0.008 | -0.27% |
|
Ethanol •726 days | 2.161 | +0.000 | +0.00% |
|
Silver •726 days | 30.82 | +1.16 | +3.92% |
 |
Silver • 726 days | 30.82 | +1.16 | +3.92% | |
|
Copper • 726 days | 4.530 | +0.111 | +2.51% | |
|
Brent Crude • 11 mins | 73.00 | -0.15 | -0.21% | |
|
Natural Gas • 11 mins | 3.320 | +0.139 | +4.37% | |
|
Heating Oil • 16 mins | 3.348 | +0.016 | +0.49% |
Article Archive | Page 1801

USD/JPY: The Key Resistance at 99.28 Has Been Broken
USD/JPY has broken the key resistance at 99.28 and is moving towards the resistance at 100.46. Hourly supports are at 99.12 (intraday low, see also the rising trendline) and 98.65…
The Gold Mining Sector Breaks a Record
The following is excerpted from a commentary originally posted at www.speculative-investor.com on 30th June 2013. We are leading off with a discussion of…
Gold Margin Call Movie Sequel
If you have seen the Kevn Spacey movie named 'Margin Call' then you have a fair idea what…
Lockheed Martin Corp: Fundamental Stock Research Analysis
Before analyzing a company for investment, it's important to have a perspective on how well the business has performed. Because at the end of the day, if you are an…
A Rare Anomaly in the Gold Market
Gold stock investors have been pummeled, including myself. Worse, we've had to hear "I told you so" from all the gold haters in the media. There are a few commentators…
Long or Short Stocks is the Question: I've Got the Answer!
Stocks managed their third session higher as of Thursday June 27th and its too late to jump onto that move. Major indexes and leading stocks have rebounded into resistance along…
Stay the Course As Mixed Signals Move Markets
Traders stampeded out of gold, emerging markets and bonds this month, setting record monthly outflows in June. Ever since the Federal Reserve hinted in May that signs of a stronger…
Stock Bulls Face Key Tests This Week
Stocks rallied to kick-off the holiday-shortened week on better than expected economic news. From Bloomberg: The Institute for Supply Management's (ISM) manufacturing index increased to 50.9 in June…
30 Year Bonds - A Rally To Sell?
Trading opportunities arise every day, however, quality trades that offer an edge do not. We use developing market activity, as depicted in charts, to find trade potentials with a defined…
Chart of the Week Video: "What Should We Be Afraid Of?"
This week's Chart of the Week video looks at yields on the 10 year Treasury Bond (symbol: $TNX.X), and asks: "What should we be afraid of?" So let's get technical.…


