


Now that spring has sprung and the Dow has sprinted more than 1,200 points from what I've identified as the technical market bottom on January 22, we've begun to hear the chant that the worst is over. I thought this all sounded too familiar, so I went back to the beginning of October 2007 and found similar "The Worst is Over" assessments from Wall Street pundits as well as former Fed chairman, Alan Greenspan. And, just days later, the market began unraveling. The Dow went on to lose more than 2,500 points.
I've also found that, back in October 2007, institutional investors shared no similar bullish sentiment as the rest of the market. The State Street's indicator of institutional investor's risk appetite continued to decline in October. It slid from the high of 117.1 in August 2007 all the way down to the low of 65.3 in December 2007 with little hesitation (see Chart 1 below). And, after 3 consecutive months of uprise, now this indicator had just turned lower again this month.
Unlike other survey-based sentiment indicators that rely on investors' "feelings" of future price expectations, the State Street Investor Confidence Index is a quantitative measure of the actual levels of risks contained in investment portfolios. It analyzes the actual buying and selling patterns of institutional investors. It reflects changes in institutional investors' portfolios in real time, as they happen, rather than investor's feelings that may be used as a deferred contrarian indicator.

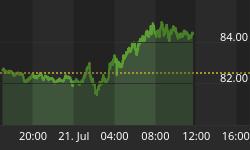
Chart 1
Incidentally, Chart 2 below shows European institutional investors confidence level, which had fallen to 76.8 this month. That's the lowest level since 2005. It would appear that neither North American nor European institutional investors believed that the worst was really over. They had become less willing to allocate their portfolios to equities. In fact, they may've been building their short positions on the rallies.

Chart 2
Of the three major indices, the Nasdaq had the largest gains over the past two months. And, the volume ratio of the Long to Short Ultra ProShares of the Nasdaq 100 ETF had surged to new highs not seen since the inception of the funds (black circle on Chart 3 below). The rise of the Ultra Long ProShares (QLD) to the Ultra Short ProShares (QID) ratio, however, means anything but bullish.
When the Nasdaq 100 (NDX) advanced more than 30% from March to the end of October in 2007, the long-short ratio of the Ultra ProShares had maintained mostly just under 15%. This low level of accumulation of the Long ProShares means low level of hedging against short positions. Institutional investors use these Ultra ProShares, which seeks to double the returns of the underlying indices, to hedge against their long and short positions. Since the market had generally been moving higher, this ratio hadn't moved past 20% till the final week of November.
After the escalation to November highs, this long-to-short ratio moved sideways from the beginning of 2008 till it broke out of the 25%-40% range on April 11. And, on April 15, it rocketed past 50% for the first time since the inception period. The rise of the ratio means the accumulation of the Ultra Long ProShares, which means the buildup of short positions, notwithstanding recent buying pressure that had pushed the major indices to the highest levels not seen since mid January.

Chart 3
So, who've been pushing the price higher? Perhaps the individual investors. According to the AAII (American Association of Individual Investors) survey, the bearish sentiment of individual investors had dropped to the lowest level last seen in October 2007 (see Chart 4 below). Since these types of feeling-based surveys can generally be used as contrarian indicators, low level of bearish sentiment may be construed as the potential market top. And we all know what had happened after October 2007.

Chart 4
Whenever the market had a double-digit rally in a hurry, it's imperative to be reminded that the fiercest rallies always happen in a bear market. And, in all likelihood, we're indeed in a long-term bear market because the housing market's in a long-term bear market. The housing market and its ancillary industries had been the major sources of employment and Wall Street's prosperity for nearly a decade. Without the backbone of the housing market, the economy will never be the same. And, without the mortgage derivatives, banking institutions' profit margins will never be the same.
Thus, when the market shoots up in a bear market, it makes it a bear market rally, not a bull market correction. You buy the dips in a bull market, but you sell the rallies in a bear market. And, that seems to be what institutional investors have been doing. For an instance, on a relatively higher volume back-to-back upday like last Thursday, when the S&P 500 gained twice as much as the previous day, large cap (SPY), mid cap (MDY), and small cap (IWM) ETF's across the board had all experienced negative cash flows.
The ratio of the dollar value of uptick trades to the value of downtick trades of SPY, MDY, and IWM were all under 1 (see Chart 5 below). Blue color bars indicate much greater disparities on large trades between institutional investors (block trades). The block trade ratio for the S&P 400 mid-cap ETF, in particular, was zero, which virtually means just selling and no buying interests from institutional investors.

Chart 5
Here we appear to have institutional investors going one way and individual investors going the other way. Who's more likely to be on the right tract? O.K. it's a rhetorical question. In any case, perhaps the worst is not over yet.


