


When you read this and hear it on the financial news networks: http://cbs.marketwatch.com/news/story.asp?siteid=mktw&dist=nwham&guid=%7BFB2FB849%2D93E0%2D4DED%2DAB8A%2D43812DBA8A43%7D it's hard to believe retail sales have really only been growing at only a 3% annual pace in recent years, and for the past seven weeks they have gone nowhere. But it's very true.
This is a classic case of how selectively taking data out of its true historical context in a hyper-bullish environment can be so unbelievable misleading when you check it out.
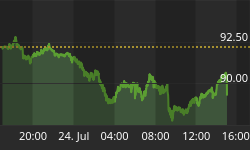
The chart below, from Dismal.com, includes the past seven years of retail sales data - in billions of dollars - with a visually obvious high-low channel reflecting the past four years.
Guess what the peak-to-peak and trough-to-trough growth rate is for that four-year channel? Yep, 3.0% per year - not the 6%, etc. crap touted by the financial media today.

The distorted stats that are reported by the media, and touted by the perma bulls, come from the misleading fact that they are measuring from last year's low to this year's high. Of course, such a 12-month growth rate is useful, especially since it usually is good seasonally adjusted metric, but you've got to look at all of the time series data if you don't want to be fooled by those with an agenda. And as you can now see - in this case - the popular 12-month rate-of-change is very deceiving.
But the true state of affairs gets worse.
Notice that although the data for the latest reported week ending 9/27/03 reflects a pickup in retail sales activity, because it is only a partially retracement of the previous three-week sharp decline, sales are the same as they were seven weeks ago - see circle.
Did the financial media report these obviously more important facts? Of course not. No one was in the "right" mood to do so.

Keep in mind that these upper and lower channel trendlines are only growing @ 3% per year.
As we reported to our investment advisor clients last month, we fully expect retail sales to decline to at least the lower channel trendline over the intermediate (months) to long term (quarters).
And this will presage the consumer-spending-led second-dip recession that we expect will be readily apparent next year.


