The volatility in the markets continues. This past month has been yet another rollercoaster ride for commodities investors.
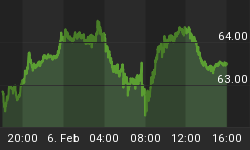
The high price of oil is all the rage lately. While it continues moving up, more and more people are starting to worry about the inflationary pressures that come with it. As far as I'm concerned, higher oil prices are here to stay, although we will see corrections from time to time (see the chart below).
When paper money continues to lose value, eventually people will turn to the backbone of the old monetary system, Gold and Silver. The higher inflation runs, the more interested people will become in owning a bit of precious metals.
Although many contend that precious metals have already had their day in the sun, this is just the beginning. Gold and Silver bugs shouldn't lose faith, but should instead try hard to keep the long term perspective in mind. Pieces will eventually fall in place; it's just a matter of time.
While I certainly understand that it is hard to keep faith when you see stocks trading more than 50% below their highs, realize that it will hurt even more if you miss the ride back up after selling at the lows.
Regards,
Roy Martens
All charts are courtesy of Stockcharts.com
GOLD

Although it seemed at first that the C bottom was set, we haven't seen any real confirmation of this yet.
The current move down could turn into a lower C bottom, making the correction a bit more complex. However, if Gold manages to break back above the MA's, chances are rising that we will see another quick move higher, followed by a break above the resistance zone at $950.
Such a move would confirm the end of the correction and should clear the way for an attack on the highs, with Gold most likely settling definitely above the $1,000 mark.
Fore now the RSI and MACD are in position to support a big move higher.
Silver

The first attempt for Silver to break above the resistance at $18.60 failed, and Silver is now backing down, falling towards the support zone at $16. This move is disappointing because the breakout would likely have brought Silver to much higher levels, not to mention that now that Silver is back below both MA's. If Silver can't manage to get back above them soon, the trend will shift to negative, and the support at $16 will come under heavy fire.
For now, it is time for the bulls to sharpen their horns and come back with a vengeance to propel Silver back above the MA's, and preferably above the resistance at $18.60.
Oil

The Oil chart still looks very strong, but a correction now seems likely in order to digest this big rise from the $85 level. Oil has gained $50 at its peak without suffering a large correction or any sort of noteworthy consolidation, and this makes it vulnerable for a bear attack in the short-run.
The current move down could turn into a correction to let off some steam and cool down the chart's internals. After such a correction or consolidation, a new longer wave up could occur, bringing Oil to much higher prices.
The RSI and especially the MACD are both in need for a correction to make enough room for another leg higher. A test of the $120 level, but most preferably $100, would be a good sign to get on board again for a departure towards new highs.
USD

The USD is trying to build some strength, and the bulls are working hard to produce a higher low. If they succeed, we will also get a higher high, and they will have established a new pattern/trend of higher lows and highs for the first time since the big fall began.
Before this pattern is established, we have to see a break above the magenta line and the resistance around 73.50. The USD is now above both the MA's and the 14 d. MA has already produced a LT buy signal, so the chances for a break higher are mounting.
The RSI, DMI (buying power), and MACD are all in good position to support a rise, and it is my personal expectation that we will see the rise occur during this upcoming month.
COPPER

The supports in the Copper chart failed, and a negative trend has begun. Copper dropped below the magenta line 2, and is now well below the 14 and 50 d. MA, both of which are starting to decline.
The target for this "correction" is the $350 level followed by the $330 zone.
The RSI, DMI (selling power) and MACD are all supporting a further move downwards.
The above is an excerpt from the technical analysis portion of the monthly Resource Fortunes Premium Newsletter publication, available in its entirety for subscribers at http://www.resourcefortunes.com/. We currently offer a 30-day trial subscription for $2.99.


