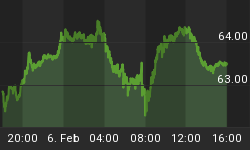
It's rather amazing that despite the firm rise in Gold and Silver these past few weeks, the mining stocks aren't moving at all. Well, that's not entirely true. The mining stocks do tend to move at times, only in the opposite direction! Needless to say, this is incredibly frustrating to all gold and silver bugs.
Mining stocks appear to be moving in sympathy with the major equities markets. Although we have seen this before, it's still amazing to see the holders of mining stocks lose faith so easily. Eventually, buyers of quality mining companies at today's bargain prices will be handsomely rewarded.
All charts are courtesy of Stockcharts.com
GOLD

The chart for gold is improving and it looks like we are in for a new jump higher very soon.
Although the presented EW count hasn't been confirmed yet (we need a rise above the black B), the conditions for a move higher are getting better and better. The 14 and 50 d. MAs are starting to rise, indicating that the LT trend is turning positive again, and as long as Gold remains above them the expectation of a breakout to new highs is valid.
The MACD is telling us that this move higher has legs to stand on, and once Gold takes out the resistance zone around $960, we can expect a strong advance to higher levels.
SILVER

Silver seems to be in the process of rounding up a bottoming pattern. This pattern will be completed once Silver breaks above the resistance at $18.60.
The conditions in the charts are getting ready for a big move higher, with the RSI, DMI (Buying Power) and MACD all in perfect shape to support a breakout above the nearby resistance zone. With Silver now just below the resistance level, not much is needed to trigger the rise. The bulls will only have to push Silver a little bit more for things to really start moving.
Above the resistance at $18.60 there are no real resistance levels to hold the price back except the double top made in March around $21.00. Therefore, it is reasonable to expect a similar rise like the one experienced at the beginning of 2008 when the resistance at $16.00 was taken out.
OIL

This chart is telling the whole story. Words are hardly necessary!
The strength in Oil is amazing. Every tiny sign of weakness attracts more and more buyers causing the price to rise higher and higher. Although this can't be sustained forever, for now we must look at the yellow channel to get some clues for the next targets. As long as the channel remains valid, we should just go with the flow.
For now, the target at the higher end of the channel is $150+ and at the lower end, $135. However, keep in mind that these targets are rising daily along with the advancing channel lines.
USD

The dollar is at a crucial stage. It has to choose which way it will go very soon.
The support at 72 has to be defended or else the positive sentiment will fade very quickly. Should the dollar manage to take out the magenta line and the MA's, we will get the prolonged rise that was anticipated last month.
For now, the signals in the chart are mixed. Things can still go either way, so we have to wait and see what the dollar has in store for us. The epic struggle between the dollar bears and bulls is in full force once again.
COPPER

Copper put in a very powerful rise this past month, and is now back up at the $400 level. Although the technical conditions are a bit overheated, it looks that this time the resistance could be taken out very quickly. While we may experience a minor correction first, the move higher was so powerful that Copper could simply blast through the resistance this coming week without any sort of breather.
The presented EW count suggests that this is only the first wave 5 higher, meaning that we should expect even more dramatic price increases going forward.


