


Zig, zag, but more zag than zig. Very strong support at the $850 level and that may be where gold is headed. Will it hold there? Most commentators suggest that a new bull move is eminent. That is not yet in the charts so we'll have to just keep on watching.
GOLD
LONG TERM
There has been no major reversal of long term type movement in the price of gold lately so no need for a long term chart yet. One can go back to the last long term P&F chart in the 18 July 2008 commentary and what we have since is a down direction of O's finishing below the up trend line but not yet going below two previous lows. So, although the direction of the plot is downwards more is required before the long term P&F chart turns bearish. At the present time that would require a move to the $855 level for a bear signal to occur. That could change, however, should the price turn to the up side to give us a new row of X's.
Gold has been bouncing above and below its moving average line and on Friday it once more moved above the still positive long term moving average line. The momentum indicator continues to move sideways within a narrow band but is still in its positive zone. The volume indicator continues to show strength and remains above its positive trigger line. For the long term the rating remains BULLISH.
INTERMEDIATE TERM

I thought I'd get a little lazy today so the chart covers both intermediate and short term indicators. On the intermediate term we have the price of gold closing the week below its moving average line although the line itself is still moving in an upward direction. The intermediate term momentum indicator seems to be right on its neutral line although a more detailed look places it just a hair below the line in the negative zone. It is also below its negative sloping trigger line. As for the volume indicator (not shown) it is still slightly above its positive trigger line. As for the intermediate term rating, this is a tough call this week. With both major indicator (moving average and momentum) trigger lines still higher one would be risky declaring a bearish rating although that's what my method would show. However, when you throw in a still positive volume indicator the rating then moves a little bit better and I would call it a - NEUTRAL rating at this time. We'll have to see what next week brings.
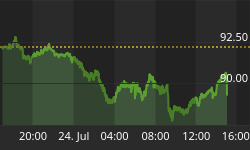
SHORT TERM
There are a couple of interesting features from the short term perspective. The most interesting is the head and shoulder pattern. The pattern had been broken this past week and projects just below the 840 level. This would, however, break below that strong 850 support so I would be a little cautious about it going to the 840 level. If it did so then much, much further decline would be in the offering. One feature of this short term head and shoulder that makes me suspect it will not work out the way it is expected to is the momentum action. I would have expected the momentum indicator to have shown a negative divergence at the location of the head. In this case it was still showing confirmation of the price move rather than a weakening of the momentum. We'll just have to see how this develops. In any case the price of gold continues to move below its negative sloping moving average line and the momentum indicator continues in its negative zone below a negative trigger line. The rating remains BEARISH in that case.
As for the immediate direction of least resistance, the Stochastic Oscillator moved above its trigger line on Monday and has been moving steadily higher ever since, suggesting short term internal strength. Although the price is still below a negative very short term moving average line I am inclined to give the SO more credit this week and suggest that the direction of immediate motion is to the up side.
SILVER
Although gold closed lower by 2.0% on the week silver had it a little better. Silver actually advanced by 0.5% during the week to show a significant difference in activity to that of gold. Maybe it's only a catch up but the silver stocks also did better than most gold stocks. Looking at the table at the end of this commentary one can see that silver is still rated in the neutral category in all three time periods while gold is all NEG. The big question is if it will continue this way. Even silver can not stand aside if gold continues to weaken.
PRECIOUS METAL STOCKS
At the end of these commentaries is a table of some twenty or so gold Indices. This includes gold itself along with silver and the U.S. Dollar Index. A Composite Index was developed based upon the components of this table. It gives us a good composite of what is happening with precious metal stocks.

When one reviews the Composite Index one can see the weakness in the bullish move from a year ago to March. As the Composite was making new highs in January and March the long term momentum indicator could not get above its previous November high. That November high itself was showing weakness in the bull move as it was so much lower that its March 2006 peak even though the Index was considerably higher. We are seeing the result of this momentum weakness. The Composite has now moved below previous lows and is heading even lower.
If you surf the internet you will find dozens of very knowledgeable commentators who will tell you that this is a great opportunity to get in on the gold stocks as they are ready to burst into new highs very soon. That may be true but I am more likely to follow the action and wait for the turn around to actually get started. In my 40 plus years at this game I have seen too often the experts proven wrong and the charts proven right to go against the charts, no matter what one may think. After all, the experts are telling you what SHOULD happen while the charts are telling you what IS happening. I'll go with the IS.
Merv's Precious Metals Indices Table

That's it for another week.


