


8/24/2008 7:40:04 PM
Index Reviews for August 22, 2008
Here's an overall review of the various major markets. This analysis has a medium term outlook. Note, the figures in brackets were the last reported figures on July 25, for comparison purposes.
| Index | Close | Support | Resistance | Primary Trend | 200 DMA |
| Financials | 20.64 (20.87) | 19.00? | 24.00 | Down | 24.99 |
The Financials are still weak but look like they may be forming a bottom, which indicates a range bound market ahead.
| Index | Close | Support | Resistance | Primary Trend | 200 DMA |
| S&P 500 | 1292 (1258) | 1250 | 1320 | Down | 1357 |
The S&P has been in a short-term uptrend that is holding so far, although there is substantial overhead resistance and so may trade in a range in the medium term between support (1250) and resistance (1320).
| Index | Close | Support | Resistance | Primary Trend | 200 DMA |
| Nasdaq 100 | 1931 (1846) | 1850 | 1950 | Side | 1900 |
The Nasdaq is still in a large symmetrical triangle, even though it's been stronger than the industrials. This means we're still in a period of indecision and most likely at the least 1850 will be tested.
| Index | Close | Support | Resistance | Primary Trend | 200 DMA |
| Dow Jones | 11628 (11370) | 11400 | 11800 | Down | 12347 |
The Dow is in essentially the same position as the S&P.
| Index | Close | Support | Resistance | Primary Trend | 200 DMA |
| Russell 2000 | 737 (710) | 720 | 760 | Side | 717 |
The Russell has been the strongest of them all, rebounding to its May peak. Like the other markets, I expect the Russell to trade sideways to down in the medium term.
| Index | Close | Support | Resistance | Primary Trend | 200 DMA |
| Volatility (VIX) | 18.81 (22.91) | 18.00 | 25.00 | Side | 23.46 |
The VIX is also indicating that we're in a period of indecision in the medium term.
| Index | Close | Support | Resistance | Primary Trend | 200 DMA |
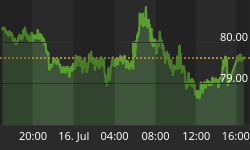
| US Dollar | 76.81 (72.85) | 74.00 | 77.00 | Side | 74.16 |
We had our first positive move with the dollar exploding higher in a parabolic move up to 77. The rise was unsustainable and now looks like it will take a breather. The test will be for the 74 level to hold.
| Index | Close | Support | Resistance | Primary Trend | 200 DMA |
| Gold | 823 (937) | 780 | 850 | Side | 896 |
Gold essentially mirrored the dollar in the opposite side and is now rallying strongly. $850 will be the test now.
| Index | Close | Support | Resistance | Primary Trend | 200 DMA |
| Crude Oil | 114 (123) | 110 | 130 | Up | 112 |
Oil fell just short of the anticipated $110 level, but it found strong support and looks ready to rebound although after Friday's drop, it could be going through a bit more of a bottoming process. If $110 breaks then the rebound scenario will have changed and $100 becomes key support.
| Index | Close | Support | Resistance | Primary Trend | 200 DMA |
| CRB | 395 (412) | 380 | 420 | Up | 400 |
The CRB index found support at 380 and now looks ready to retrace some it's large decline.
| Index | Close | Support | Resistance | Primary Trend | 200 DMA |
| Bonds (TLT) | 93.08 (90.14) | 89.00 | 94.00 | Side | 92.00 |
Bonds are looking stronger, they may take a breather before proceeding higher and breaking 94.
| Index | Close |
| Put/Call Ratio | 0.88 (0.83) |
Looking at history, when the ratio of put options to call options is around 0.70 it indicates a short-term top, whereas a figure of around 1.50 indicates a short term bottom. The current figure of 0.88 indicates that possibly some comfort is starting to creep in, so be wary about rises in the market short term (note, this ratio can change very quickly so this is mainly useful when you see an extreme in the ratio).
SUMMARY
The trend in industrials is moving higher but there is substantial overhead resistance and so a major push upwards seems unlikely in the near term, having said that, the down side looks limited also, which leads to the only other option, which is range bound for the near term.
Financials may be bottoming which will help support the overall market from dropping too far. Commodities have found support and are rebounding. Dollar and gold finally broke their tight ranges in an explosive manner and are now retracing. Finally, Bonds seem ready to go higher in the not too distant future.
The conclusion is that the markets are likely entering a period of wait and see which will have stocks lift a little short term but drift down in September and possible October. However, we do remain positive for a move higher post election.


