


The good news is:
There are 3 trading days remaining in the seasonally strong period that began last week.
In a rising market I look to the down days for clues about the market's strength and, for all practical purposes, there have been no down days in the past week. The typically low volume of Thanksgiving week compounds the difficulty analyzing the market's technical condition.
Nearly all of the broad market indicators headed sharply upward all week. Usually I try to balance the positive vs. negative indicators to get a perspective as to what is really going on.
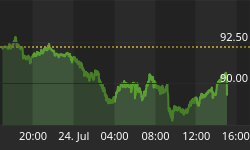
The chart below is the most negative one I could find. The green line plots a 10% trend (19 day exponential moving average (EMA)) of new highs of the component issues of the S&P 500 (SPX). New highs in this chart have been calculated on a trailing 6 week basis (rather than a trailing 52 week basis as reported by the exchanges). The chart shows there have been fewer new highs while the index is only 0.1% off its cycle high. The implication is the index has been carried to new highs by fewer issues.
Unpleasant as the chart is, keep in mind, it is the worst one I could find.

Like last week, the big story is seasonality.
The tables below show the first 5 trading days of December for the past 14 years for the Russell 2000 (R2K), Wilshire 5000 and the S&P 500.
Typical of all seasonally strong periods the small cap R2K has the best record followed by the Wilshire 5000 and SPX.
This period of seasonal strength ends Wednesday.
First 5 days of December:
• The number following the daily return represents the day of theweek;
• 1 = Monday, 2 = Tuesday etc.
• The number following the year is its position in the 4 year presidentialcycle.
| R2K | Day1 | Day2 | Day3 | Day4 | Day5 | Totals |
| 1989-1 | 0.20% 5 | 0.05% 1 | -0.09% 2 | 0.26% 3 | -0.17% 4 | 0.24% |
| 1990-2 | 0.50% 1 | 0.45% 2 | 1.53% 3 | 0.33% 4 | -0.14% 5 | 2.68% |
| 1991-3 | 0.16% 1 | 0.42% 2 | 0.24% 3 | -0.33% 4 | 0.18% 5 | 0.67% |
| 1992-4 | 0.00% 2 | 0.19% 3 | 0.27% 4 | 0.00% 5 | 1.23% 1 | 1.68% |
| 1993-1 | 0.88% 3 | 0.12% 4 | 0.38% 5 | 0.05% 1 | 0.02% 2 | 1.44% |
| 1994-2 | -0.91% 4 | 0.32% 5 | 0.05% 1 | -0.38% 2 | -0.76% 3 | -1.68% |
| 1995-3 | 0.38% 5 | 0.89% 1 | 0.19% 2 | -0.14% 3 | -0.55% 4 | 0.77% |
| 1996-4 | 0.35% 1 | 0.70% 2 | 0.08% 3 | 0.27% 4 | -0.99% 5 | 0.40% |
| 1997-1 | 0.99% 1 | -0.39% 2 | 0.31% 3 | 0.25% 4 | 0.72% 5 | 1.88% |
| 1998-2 | 0.25% 2 | -0.31% 3 | -0.63% 4 | 0.85% 5 | 0.70% 1 | 0.87% |
| 1999-3 | -0.09% 3 | 1.49% 4 | 0.90% 5 | 0.25% 1 | -0.01% 2 | 2.54% |
| 2000-4 | 2.44% 5 | -1.41% 1 | 4.61% 2 | -1.62% 3 | -0.53% 4 | 3.50% |
| 2001-1 | -0.81% 1 | 2.37% 2 | 2.48% 3 | 0.59% 4 | -0.21% 5 | 4.40% |
| 2002-2 | 0.54% 1 | -1.89% 2 | -0.82% 3 | -0.77% 4 | 0.58% 5 | -2.37% |
| Averages | 0.35% | 0.22% | 0.68% | -0.03% | 0.01% | 1.22% |
| % Winners | 71% | 71% | 79% | 62% | 43% | |
| Wilshire 5K | Day1 | Day2 | Day3 | Day4 | Day5 | Totals |
| 1989-1 | 1.07% 5 | 0.18% 1 | -0.39% 2 | -0.12% 3 | -0.22% 4 | 0.52% |
| 1990-2 | 0.59% 1 | 0.68% 2 | 1.23% 3 | -0.11% 4 | -0.34% 5 | 2.06% |
| 1991-3 | 1.35% 1 | 0.03% 2 | -0.08% 3 | -0.52% 4 | 0.36% 5 | 1.13% |
| 1992-4 | -0.06% 2 | -0.19% 3 | 0.10% 4 | 0.47% 5 | 0.70% 1 | 1.01% |
| 1993-1 | 0.32% 3 | 0.22% 4 | 0.36% 5 | 0.27% 1 | 0.09% 2 | 1.26% |
| 1994-2 | -1.01% 4 | 0.72% 5 | 0.01% 1 | -0.14% 2 | -0.47% 3 | -0.90% |
| 1995-3 | 0.18% 5 | 1.05% 1 | 0.49% 2 | 0.16% 3 | -0.63% 4 | 1.25% |
| 1996-4 | 0.05% 1 | -0.62% 2 | -0.42% 3 | -0.01% 4 | -0.70% 5 | -1.71% |
| 1997-1 | 1.80% 1 | -0.25% 2 | 0.50% 3 | -0.13% 4 | 0.97% 5 | 2.88% |
| 1998-2 | 0.76% 2 | -0.27% 3 | -1.49% 4 | 1.90% 5 | 0.98% 1 | 1.89% |
| 1999-3 | 0.56% 3 | 1.11% 4 | 1.64% 5 | -0.46% 1 | -0.44% 2 | 2.41% |
| 2000-4 | 0.51% 5 | 0.39% 1 | 4.41% 2 | -1.73% 3 | -0.56% 4 | 3.02% |
| 2001-1 | -0.83% 1 | 1.45% 2 | 2.26% 3 | -0.11% 4 | -0.71% 5 | 2.05% |
| 2002-2 | -0.06% 1 | -1.53% 2 | -0.40% 3 | -1.08% 4 | 0.60% 5 | -2.47% |
| Averages | 0.37% | 0.21% | 0.59% | -0.11% | -0.03% | 1.03% |
| % Winners | 71% | 64% | 64% | 29% | 43% | |
| S&P 500 | Day1 | Day2 | Day3 | Day4 | Day5 | Totals |
| 1989-1 | 1.34% 5 | 0.22% 1 | -0.52% 2 | -0.29% 3 | -0.28% 4 | 0.47% |
| 1990-2 | 0.58% 1 | 0.69% 2 | 1.09% 3 | -0.26% 4 | -0.40% 5 | 1.71% |
| 1991-3 | 1.65% 1 | -0.12% 2 | -0.23% 3 | -0.71% 4 | 0.45% 5 | 1.05% |
| 1992-4 | -0.13% 2 | -0.21% 3 | 0.00% 4 | 0.50% 5 | 0.75% 1 | 0.92% |
| 1993-1 | 0.02% 3 | 0.26% 4 | 0.38% 5 | 0.33% 1 | 0.07% 2 | 1.07% |
| 1994-2 | -1.05% 4 | 0.98% 5 | 0.00% 1 | -0.05% 2 | -0.41% 3 | -0.53% |
| 1995-3 | 0.27% 5 | 1.10% 1 | 0.65% 2 | 0.40% 3 | -0.65% 4 | 1.78% |
| 1996-4 | -0.06% 1 | -1.09% 2 | -0.42% 3 | -0.10% 4 | -0.64% 5 | -2.32% |
| 1997-1 | 2.03% 1 | -0.32% 2 | 0.52% 3 | -0.38% 4 | 1.10% 5 | 2.96% |
| 1998-2 | 1.00% 2 | -0.34% 3 | -1.80% 4 | 2.31% 5 | 0.93% 1 | 2.10% |
| 1999-3 | 0.63% 3 | 0.81% 4 | 1.72% 5 | -0.70% 1 | -0.99% 2 | 1.48% |
| 2000-4 | 0.02% 5 | 0.74% 1 | 3.89% 2 | -1.82% 3 | -0.59% 4 | 2.25% |
| 2001-1 | -0.84% 1 | 1.32% 2 | 2.23% 3 | -0.28% 4 | -0.75% 5 | 1.68% |
| 2002-2 | -0.19% 1 | -1.47% 2 | -0.35% 3 | -1.20% 4 | 0.63% 5 | -2.58% |
| Averages | 0.38% | 0.18% | 0.51% | -0.16% | -0.06% | 0.86% |
| % Winners | 64% | 57% | 64% | 29% | 43% | |
My forecast for next week is a seasonal bet. During the first 5 trading days of December, the R2K has been up 86% of the time in the past 14 years while the Wilshire 5K and SPX have been up 79% of the time. Those are odds I will take.
I expect the major averages to be higher at the close Friday December 5 than they were at the close Friday November 28.


