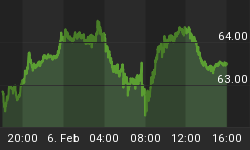
Chart 1
Note: Horizontal line is where the Nikkei 225 closed on October 22, 2008.
Chart 2
Note: Horizontal line is where the NASDAQ closed on October 22, 2008.
 |
Gold •584 days | 2,368.70 | +35.30 | +1.51% |
 |
Platinum •10 mins | 2,099.40 | +28.80 | +1.39% |
 |
WTI Crude •22 hours | 63.55 | +0.26 | +0.41% |
 |
Gasoline •22 hours | 1.953 | +0.027 | +1.38% |
 |
Ethanol •584 days | 2.161 | +0.000 | +0.00% |
 |
Silver •584 days | 30.82 | +1.16 | +3.92% |
 |
Silver • 584 days | 30.82 | +1.16 | +3.92% | |
 |
Copper • 584 days | 4.530 | +0.111 | +2.51% | |
 |
Brent Crude • 21 hours | 68.05 | +0.50 | +0.74% | |
 |
Natural Gas • 22 hours | 3.422 | -0.087 | -2.48% | |
 |
Heating Oil • 22 hours | 2.413 | +0.020 | +0.84% |


Wells Fargo has done it…

More freeports open around the…

The Economic Community of West…
Chart 1
Note: Horizontal line is where the Nikkei 225 closed on October 22, 2008.
Chart 2
Note: Horizontal line is where the NASDAQ closed on October 22, 2008.