• 735 days Will The ECB Continue To Hike Rates?
  • 735 days Forbes: Aramco Remains Largest Company In The Middle East
  • 737 days Caltech Scientists Succesfully Beam Back Solar Power From Space
  • 1,137 days Could Crypto Overtake Traditional Investment?
  • 1,141 days Americans Still Quitting Jobs At Record Pace
  • 1,143 days FinTech Startups Tapping VC Money for ‘Immigrant Banking’
  • 1,146 days Is The Dollar Too Strong?
  • 1,147 days Big Tech Disappoints Investors on Earnings Calls
  • 1,148 days Fear And Celebration On Twitter as Musk Takes The Reins
  • 1,149 days China Is Quietly Trying To Distance Itself From Russia
  • 1,150 days Tech and Internet Giants’ Earnings In Focus After Netflix’s Stinker
  • 1,154 days Crypto Investors Won Big In 2021
  • 1,154 days The ‘Metaverse’ Economy Could be Worth $13 Trillion By 2030
  • 1,155 days Food Prices Are Skyrocketing As Putin’s War Persists
  • 1,157 days Pentagon Resignations Illustrate Our ‘Commercial’ Defense Dilemma
  • 1,157 days US Banks Shrug off Nearly $15 Billion In Russian Write-Offs
  • 1,161 days Cannabis Stocks in Holding Pattern Despite Positive Momentum
  • 1,161 days Is Musk A Bastion Of Free Speech Or Will His Absolutist Stance Backfire?
  • 1,162 days Two ETFs That Could Hedge Against Extreme Market Volatility
  • 1,164 days Are NFTs About To Take Over Gaming?
How The Ultra-Wealthy Are Using Art To Dodge Taxes

How The Ultra-Wealthy Are Using Art To Dodge Taxes

More freeports open around the…

Another Retail Giant Bites The Dust

Another Retail Giant Bites The Dust

Forever 21 filed for Chapter…

Zombie Foreclosures On The Rise In The U.S.

Zombie Foreclosures On The Rise In The U.S.

During the quarter there were…

  1. Home
  2. Markets
  3. Other

Update of Post Coppock Curve Buy Signal Patterns

Here's an update of the 5 charts shown in my October 21, 2003 communication:

First comes a scatter chart in which the CI-NCI Ratio smoothed by six 10-day moving averages is plotted against the NYSE Trin smoothed by six 10-day moving averages. The time span covers the first 142 trading days after the 4/28/78 and 5/30/03 deep monthly DJIA Coppock Curve buy signals.

Second and third come line charts showing each of the above 2 coordinates separately over the 500 trading days before and after the same 2 signal dates.


Fourth comes the latest update of the Monthly DJIA line chart showing the 24 months before and after the same 2 signals.

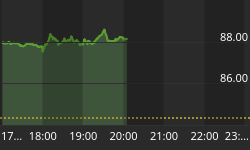
Fifth comes a line chart of Peter Eliades' CI-NCI Ratio.

The CI-NCI Ratio appears at last to be topping out. Based on its formula alone (it being a 189 day moving average) the overall trend of this indicator should be biased downward for the next 9 months, even if the DJIA rises. This is because the many positive daily A/D readings which occurred since the start of April have begun dropping out of the equation. A down DJIA would only accentuate this effect.

Meanwhile, the Six by Ten CI-NCI Ratio should top out in about a month. In the coming months, that indicatior should show up in the above scatter chart as a move to the left by the current (green) curve. For it to emulate the 1978 (coral) curve by dropping steeply downward while edging left, a down DJIA in early 2004 would no doubt be required to generate enough large Trin readings.

Back to homepage

Leave a comment

Leave a comment