


Gold traders should have exited today as prices are showing strong signs of lower prices in the near future. Gold slid over 4% this week so far, while gold stocks have dropped an average of 9%.
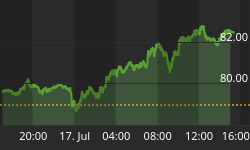
The weekly chart shows a very clear picture of resistance for gold which was reached last week and we are starting to see sellers step in now. Also my custom stochastic indicates gold has reached a short term top. Prices could retrace (pullback) to $700 level but I am hopeful that prices will hold around the $800 level. We will continue to watch it unfold.
Weekly Gold Trading Chart
Gold Stocks Lead the Price of Gold
In many cases gold stocks tend to lead gold. This daily chart below clearly shows a classic 5 wave counter trend rally and trend line breakdown. Gold stocks hit resistance last week and have been sliding lower since hitting their heads on the 200 moving average. Stochastic and MACD both signaled this is a high probability move, indicating there could be much more downside pressure.
Daily Gold Stock Chart
Gold Trading Fund and Analysis
The price of gold continues to have sellers stepping in this week. We continue to hold our core position as gold consolidates (pulls back) while short term traders take profits. We are looking for prices to drift lower and hold above the support trend line providing a reversal candle and pivot low with risk less than 3% for our next entry point. If gold stocks take another big hit this week then the HUI:GLD ratio will turn bearish and that's not good for the price of gold. All we can do now is to wait it out.
Daily GLD Exchange Traded Fund
Conclusion:
The broad market as well as commodities have been holding their ground and making small gains for the past month. Fewer buyers seem to be at these higher prices, leaving me with a cautious vibe. Stick with your stops; you can always buy back in.
I will provide a full Special Report covering Gold, Silver and Oil this weekend. For more information please visit my website: Chris Vermeulen www.TheGoldAndOilGuy.com.


