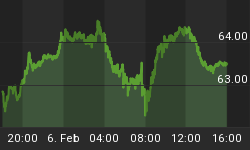
Both the SPDR Gold Shares (NYSE: GLD) and the iShares Silver ETF (AMEX: SLV) reversed to the upside Friday morning after getting hammered during the post-Employment Report decline in equity prices, which also happened to coincide with a very strong upmove in the dollar.
Neither the strength in the dollar nor the recovery of the GLD or the SLV make intuitive sense, so let's see what the chart work about the SLV tells us, if anything. Looking at the 4-hour chart, the pattern carved out by the SLV since late Oct exhibits a series of higher lows and higher highs, while the pattern since mid-December reflect horizontal highs juxtaposed against rising pullback lows. Both the October-present and the December-present "pattern within a pattern" suggests buyers are being aggressive into weakness and are continually putting upward pressure on key resistance in the vicinity of 11.50, which if (when) hurdled should trigger a powerful upside reaction that projects to 12.20/60 initially.
At this juncture, only a breach of the series of higher lows, at this morning's low of 10.84, will begin to compromise the now compellingly bullish pattern.


