As you are well aware, the market is often in conflict with opposing conditions.
Take the VIX and the S&P's Relative Strength for instance.
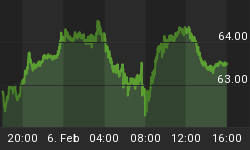
If you look at yesterday's VIX (Volatility Index), you would see that it appeared to be moving down with a nice lower tick. Then, if you looked at the S&P, it had a nice up tick that gave the appearance of a new short term move to the upside.
So, is this a nice, clean condition for a short term upside move?
One important indicator to consider is the Relative Strength ... especially when it appears to be in opposition.
The combination mix of movements with the VIX vs. the C-RSI is what is important ... not the VIX by itself. Below is a chart of the possible VIX/C-RSI combinations and their affect on the market:

So, let's look at today's VIX and C-RSI reading.
At the close yesterday, the VIX was moving down, and the C-RSI was NEGATIVE. If we look at the chart above, the affect on the market is traditionally neutral which gives the market a "sideways, trading range" condition.
What that means ... is that the market can go higher on the short term, but within the extremes of the trading range.
As long as the VIX is moving down, and the C-RSI is moving up while in Negative Territory, then the S&P will move up on an intra-day basis ... and do so within its trading range. If the VIX is moving down, and the C-RSI starts moving down, then this opposing force neutralizes intra-day up movement attempts.
"Trading Range" conditions are volatile and unstable conditions because there is no upside or downside trend in place. Instead, there are up an down moves within the upper and lower boundaries of the trading range.
FYI: What's a C-RSI? It is a version of the standard Relative Strength Index. On the C-RSI, a value of 50 is subtracted from the RSI so that the Relative Strength will "show a zero reading when neutral".
This allows one to easily see when the Relative Strength is positive or negative due to its position above or below the horizontal line.


