2/1/2009 5:22:20 PM
It's like déjà vu all over again.
Welcome to Lynn T's 1-2-3 PLUS Alert. To learn more about my Partial Leverage Utilization System, click here.
If you are interested in continuing to receive these alerts, subscribe by clicking here.
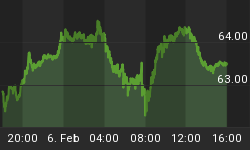
Much like Bill Murray in the comedy titled the same as this article, the market seems to be living the same day (okay, set of days) over and over and over again. We can't seem to break out of the consolidation that has had its giant claws holding price levels down since the extraordinary drop in the beginning of October. A little move up, then a little move down. A seemingly big down move, then a seemingly big move up. See the channel that has been built for the market to move in? Ever sideways - or so it would seem for now.
Soon enough things will have to change, and I don't see them going drastically lower. We'll stay where we are as far as weighting and see what the next phase of Obama's time as president has to offer.
No change in position (see weighting below).

Current Weighting Suggestion:
1/3 in Bullish Leverage
2/3 in CASH mode
Long Term Investor Buy Signal Alert
Over the past several years, this indicator has predicted several 100-point or more moves in the S&P. There are only 2 to 3 of these signals every year, so they're worth paying attention to. This is an ideal signal for investors to put cash to work following a down move in the market.
A Long Term Investor Buy Signal Alert was issued October 29, 2008. The last long term investment signal was issued on July 23 where the S&P advanced 62 points.
Long Term Investor Crash Warning Indicator
This indicator is a variation of the widely published Hindenburg Omen. We'll let you know when we're seeing indications of a potential crash to come. This would be a good time for long term investors to take some money off the table.
This indicator is not coming into play at this point in time.
You can email me with any questions at plus@stockbarometer.com.
Have a great week!


