


The good news is:
• A few people believe a large barrel of pork will save the economy.
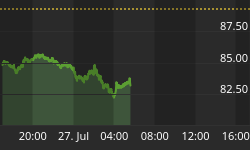
Short Term
The market is overbought.
The market managed to rise 4 out of 5 days last week leaving it overbought by some short term measures.
The chart below covers the past 100 trading days showing the S&P 500 (SPX) in red and an indicator that is momentum of the ratio of NYSE advancing issues to advancing + declining issues (NY AD Ratio) in green. Dashed vertical lines have been drawn on the 1st trading day of each month.
NY AD Ratio is as high as it has been any time showing on the chart and every other time the indicator was near this high the market declined for a few days.

The chart below is similar to the one above except it uses a different data set.
The index is the NASDAQ composite (OTC) shown in blue and the indicator is momentum of the ratio of NASDAQ volume of advancing issues to volume of advancing + declining issues (OTC UD Ratio) shown in olive drab.
OTC UD Ratio is also as high as it has been at any time in the last 100 trading days.

Intermediate term
New lows increased a bit last week and new highs remained near the lowest levels they have ever seen.
The chart below covers the past year showing the SPX in red and a 40% trend (4 day EMA) of NYSE new highs divided by new highs + new lows. Dashed vertical lines have been drawn on the 1st trading day of each month and dashed horizontal lines have been drawn at 10% levels for the indicator the horizontal line is solid at the 50% level.
The chart is an update of the one I showed last week, the indicator fell while prices were rising last week.

The chart below covers the past 9 months showing the SPX in red and a 10% trend (19 day EMA) of NYSE new highs in green. The indicator is near its lowest levels ever.

Seasonality
Next week is the week prior to the 2nd Friday of February during the 1st year of the Presidential Cycle.
The tables show the daily return on a percentage basis for the week prior to the 2nd Friday of February during the 1st year of the Presidential Cycle. NASDAQ composite (OTC) data covers the period from 1963 - 2008 and SPX data from 1953 - 2008. Prior to 1953 the market traded 6 days a week so that data has been ignored. There are summaries for both the 1st year of the Presidential Cycle and all years combined.
OTC returns over all years have been slightly positive, returns by all other measures have been negative.
Report for the week before the 2nd Friday of February
The number following the year is the position in the presidential cycle.
Daily returns from Monday to 2nd Friday.
| OTC Presidential Year 1 | ||||||
| Year | Mon | Tue | Wed | Thur | Fri | Totals |
| 1965-1 | -0.33% | -0.25% | 0.53% | -1.38% | -0.59% | -2.03% |
| 1969-1 | 0.00% | 0.25% | -0.23% | 0.32% | 0.00% | 0.34% |
| 1973-1 | -0.36% | -0.38% | 0.21% | -1.01% | -0.82% | -2.36% |
| 1977-1 | -0.13% | -0.02% | -0.62% | 0.31% | -0.21% | -0.67% |
| 1981-1 | -0.48% | -0.12% | -0.45% | -0.61% | -0.37% | -2.03% |
| 1985-1 | 0.84% | 0.69% | 0.62% | 0.96% | 0.40% | 3.51% |
| Avg | -0.03% | 0.09% | -0.10% | -0.01% | -0.25% | -0.24% |
| 1989-1 | -0.09% | 0.79% | -0.30% | -0.39% | -0.99% | -0.98% |
| 1993-1 | -0.36% | -0.89% | 0.41% | 0.12% | -0.77% | -1.49% |
| 1997-1 | -1.65% | -0.29% | 2.07% | 0.86% | -0.26% | 0.74% |
| 2001-1 | -0.65% | 0.81% | -2.13% | -1.75% | -3.56% | -7.28% |
| 2005-1 | -0.22% | 0.22% | -1.64% | 0.03% | 1.15% | -0.46% |
| Avg | -0.59% | 0.13% | -0.32% | -0.23% | -0.88% | -1.89% |
| OTC summary for Presidential Year 1 1965 - 2005 | ||||||
| Avg | -0.34% | 0.07% | -0.14% | -0.23% | -0.60% | -1.16% |
| Win% | 10% | 45% | 45% | 55% | 20% | 27% |
| OTC summary for all years 1963 - 2008 | ||||||
| Avg | -0.08% | -0.04% | 0.08% | 0.23% | -0.06% | 0.12% |
| Win% | 40% | 52% | 57% | 67% | 56% | 57% |
| SPX Presidential Year 1 | ||||||
| Year | Mon | Tue | Wed | Thur | Fri | Totals |
| 1953-1 | -0.46% | -0.27% | 0.08% | 0.00% | 0.39% | -0.27% |
| 1957-1 | -0.20% | -1.44% | -0.16% | -0.46% | -0.69% | -2.94% |
| 1961-1 | -0.74% | -0.18% | 0.91% | -0.31% | -0.84% | -1.15% |
| 1965-1 | -0.39% | 0.33% | -0.89% | -1.06% | 0.74% | -1.28% |
| 1969-1 | 0.00% | 0.12% | -0.98% | 1.05% | -0.10% | 0.09% |
| 1973-1 | -0.10% | 0.19% | -0.69% | -0.44% | 1.34% | 0.30% |
| 1977-1 | 0.01% | -0.28% | -0.86% | 0.09% | -0.60% | -1.64% |
| 1981-1 | -1.02% | -0.02% | -0.77% | -0.59% | -0.39% | -2.80% |
| 1985-1 | 0.96% | 0.14% | -0.10% | 0.77% | 0.20% | 1.98% |
| Avg | -0.04% | 0.03% | -0.68% | 0.18% | 0.09% | -0.41% |
| 1989-1 | -0.31% | 1.21% | -0.33% | -0.87% | -1.36% | -1.66% |
| 1993-1 | -0.24% | -0.56% | 0.20% | 0.32% | -0.69% | -0.97% |
| 1997-1 | -0.52% | 0.53% | 1.67% | 1.13% | -0.41% | 2.39% |
| 2001-1 | 0.36% | -0.15% | -0.84% | -0.62% | -1.33% | -2.59% |
| 2005-1 | -0.11% | 0.05% | -0.86% | 0.42% | 0.69% | 0.20% |
| Avg | -0.17% | 0.22% | -0.03% | 0.08% | -0.62% | -0.53% |
| SPX summary for Presidential Year 1 1953 - 2005 | ||||||
| Avg | -0.21% | -0.02% | -0.26% | -0.04% | -0.22% | -0.74% |
| Win% | 23% | 50% | 29% | 46% | 36% | 36% |
| SPX summary for all years 1953 - 2008 | ||||||
| Avg | -0.24% | -0.09% | 0.13% | -0.01% | 0.03% | -0.18% |
| Win% | 37% | 46% | 61% | 40% | 51% | 55% |

Conclusion
Last weeks rally from a deeply oversold condition coincided with a period of seasonal strength. The market is now overbought entering a seasonally weak period.
I expect the major indices to be lower on Friday February 13 than they were on Friday February 6.
This report is free to anyone who wants it, so please tell your friends. They can sign up at: http://alphaim.net/signup.html. If it is not for you, reply with REMOVE in the subject line.
Last weeks negative forecast was a miss.
Thank you,


