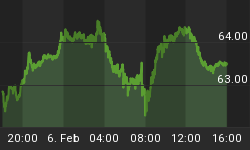
The latest run-up in gold's secular bull market has reaches 7-month highs of $947/oz, triggered by an initial decline in the US dollar following a disappointing Tuesday market reception of the US Financial Stability Plan. Remarkably, however, gold shifted to the next gear despite a rebound in the US currency or the decline in oil prices, underscoring the metals improving allure as a yield replacement during interest rate-eroding policies in the industrialized world.
The high profile divergence between gold and oil is a stark reminder that inflation is not the only pre-condition for a surge in the metal. The gold-oil ratio reached a 10-year high of 25 as the global recession erodes demand for energy commodities and investors abandon monetary assets in favour of the safe haven metal. Before assessing the market implications of the surge in the gold-oil ratio, lets recall the September 18 piece warning that the recovery in the ratio from its July record low augured negatively for U.S growth in particular and the world economy in general. The rationale was based on the notion that multi-year lows in the G.O. ratio reflected soaring energy prices, which were instrumental in bringing the world economy to a standstill. The rebound in the G.O. ratio ensued as financial markets unwound gold longs and central banks reverted to interest rate cuts.

Now that global central banks are flirting with zero interest rates and the world economy in contraction mode, the ratio faces no prospects of a pullback any time soon. Only a decline of at least 20-25% in the G.O. ratio would signal the markets pricing of a recovery (pace of oil rebound outpaces that of gold). The above chart serves as a helpful historical guide indicating pullbacks in the G.O. ratio (white graph) generally coincided with stabilization in the US economy, while rebounds in the ratio preceded a broadening slowdown. Particularly positive for gold is that a pullback in the G.O. ratio may not necessarily occur at the expense of the metal, but rather, a recovery in oil relative to gold. This was seen in 2002 and 2004, when the decline in the ratio emerged mainly on a faster increase in oil than in gold, and not on a decline in oil. Thus, any economic recovery strong enough to support energy demand is likely to boost gold on industrial demand for metals and investor interest in gold funds.

The speculative element to golds surge is reflected in the 138% increase attained by speculative net longs in gold futures to a 9-month high of 155,306 contracts (see above chart). Speculative longs as a percentage of total open interest reached 52%, the highest since July, suggesting further upside remains ahead. Interestingly, the record high in golds net speculative longs was reached in December 2007, three months before the metal hit its all time highs. The 3-month lag between golds net longs and multi-year highs also took place in 2006. Thus, even if speculative net longs regain record territory above 200K contracts, prices may have at least 2-3 months of upward momentum. The prospects for $1,200-1,300 gold by end of Q3 remain underpinned by a set of cogent fundamental variables involving currencies, interest rates and the global economy. Meanwhile, even as the divergence between gold and oil begins to fade, any oil-friendly dynamics are seen positive for gold's luster.
For more detailed analysis on the market and economic implications of the gold-oil ratio, go to Chapter 6 of my book Currency Trading & Intermarket Analysis.


