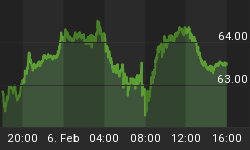
Gold and silver have had one hell of a run in the recent days. Both looked like they were topping weeks ago but recent bad news hit the wires making investors buy gold like the stock market is about to go under. Gold bullion inflows are the highest it has been in 6 months!
The massive gold inflows can be seen two ways:
- Gold is about to shoot through the roof as everyone around the world piles in as a safe haven for their money.
- We are getting the same inflows which we had when gold topped out 6 months ago, indicating investors are loading up on gold cause it looks so bullish, but really they are the last of the buyers before this 3 months rally ($300 gain per ounce) is ready for a cool down phase.
The charts below you can see that gold stocks have not been out performing gold for two months. Generally this is a bearish sign for gold. While gold could continue higher, I think a correction is possible any day which will allow for some profit taking and both the price of gold and gold stocks to recharge before another leg higher.
Gold Stocks/Spot Gold Price
This chart should be increasing in value while gold rises but it has not for almost two months. Does the smart money know something we don't?

Gold Bugs Index - Daily Chart
The gold bugs index shows us how gold stocks are performing as a basket. As you can see in the chart below they have been more or less moving sideways while gold climbs. The momentum MACD has gone flat and stochastics is making a lower high. Again this is just a different look at how gold stocks are performing.

Spot Gold - GLD Daily Trading Chart
Gold trading has been choppier than ever in the recent months making it difficult to get in with minimal risk. When the market is this volatile it's important to only put a portion of your money to work as stocks and commodities can change direction very quickly and take a large chunk of your funds. Keeping bets small or staying out of the market until volatility settles is the best way to deal with this. There are great opportunities each week to make money so don't get to stressed out trying to pick a bottom.
Gold has been moving higher and with the recent negative news it has pushed higher once again. As you can see in the chart gold is now trading at the top of its trading channel with the stochastics indicator at the top if its range as well. With the price of gold about 12% above its support trend line it is obvious that it looks ready for a correction before a new leg higher.

Silver SLV - Daily Trading Chart
Silver has been on a tear for the past month and today it gapped higher and kept moving again. This price movement looks like a parabolic spike in the making and when it reverses I expect a sharp snap back which silver is known for doing. Again we must wait for correction before putting money to work in silver.

Crude Oil Commodity Chart
Crude oil continues to be under pressure and has not been able to break above the 40 period moving average. Although oil is trying to hold its ground and has been doing a good job for the past 2 months, I still think it has more room to the down side. Both the MACD is looking like it's about to roll over and stochastics has made a hook and lower high. If we get a setup in an oil fund I will be looking to short oil soon.

Gold, Silver, & Crude Oil Commodity Conclusion:
In short all three commodities look ready to move lower as the short term underlying technical's are bearish. I would like to note that gold generally is a leading indicator for other commodities which you can see going back to the 1970's. And with any luck we will see rising price across the board in the next few months.
For those of you looking to go long gold, silver or oil, I think waiting for some type of pullback is needed. The keys to successful trading are knowledge, discipline, and patience. If you have the knowledge of how the market works, the best way to achieve discipline and patience is to do your home work and stick with your action plan. Don't carry a losing position if it goes beyond your exit point. Exit and find a fresh trade with lots of opportunity.
If you would like to receive my newsletter and trading signals please visit my website at www.TheGoldAndOilGuy.com.


