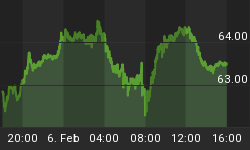
What a crazy day! The Fed's announced plans to buy long-term Treasury bonds and increase its purchases of mortgage backed securities today sending everything higher except the US dollar which plummeted nearly 3% Wednesday.
Gold sold down into previous support levels during the morning only to snap back making a 7% price swing on the day. Gold closed up 3.4% on the session with an enormous engulfing bullish candle. The strong close sets the stage for a steady to higher open Thursday morning.
Take a look at these charts to get a feel for where gold prices stand in the grand scheme of things.
Gold Miners Index - Weekly Chart

As you can see above miner stocks tested support and is currently bouncing off that level. This chart indicates we could see miner stocks surge an average of 20% higher in the next couple months. Sorry the chart is smaller than I thought, tough to see.
Gold Equities VS Gold - Weekly Chart

Gold stocks surged higher Wednesday breaking above our short term resistance trend line. This chart is showing next resistance at 0.40 level which means gold stocks could out perform the price of gold 16% over the next few months. This is very bullish for the price of gold bullion.
Gold Bugs HUI Daily Chart

This chart shows gold stocks surging an average of 9% Wednesday while gold only surged 3.4%. Gold stocks are currently testing resistance at the 200 moving average and multi week high. A breakout above the Feb high will most likely trigger a surge higher in both gold and gold stocks.
Gold Bullion Price Action - GLD Daily Chart

Gold has been trending higher bouncing off the channel lines and has bounced twice off support in the past 6 trading days. Today's bounce was massive and very bullish. I expect gold to open higher Thursday with over night traders jumping on the band wagon around the world.
Gold Trading Conclusion:
Wednesday's reversal candle carries about 7% risk from the low of the day if one is to go long here. Gold (GLD) signaled a buy signal when it bounced off the channel support trend line a week ago at the $89 level. I waited for a breakout of the short term resistance trend line before I took a position.
I have had a lot of emails today wondering how I did not get shaken out of my long position in gold today.
I watch the markets every day and trade accordingly. If I am around I do not set stop orders, I like to watch the price movements and with gold currently at support levels (50 EMA, trend line support, and previous lows) I decided to hold the position in hopes for a bounce. Things worked out well with Bernanke sending out a message of good news forcing a bounce higher. Thank You Bernanke!
Trading is a complete mix of art and science and if you have the time and skills to focus on it full time it's amazing how in sync you can be with the market. It's much more difficult for EOD (end of day) traders to avoid whipsaw price action like this without their stop orders getting hit. Gold looks like a good buy signal with today's price action. I expect we will get some type of pullback as profit takers step in and pull prices back down for a day or two.
If you would like to receive my free weekly gold, silver and oil trading reports please visit my website: www.TheGoldAndOilGuy.com.


