


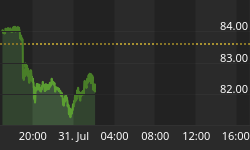


Gold bounces off support again today with some indicators pointing to much higher prices.
GLD Gold ETF Fund - Daily Trading Chart
This week gold has been pulling back after last week's massive one day rally. Hopefully that rally was not a one-day wonder but rather a sign that smart money is still moving into gold and not most retail traders trying to make a quick buck.

Gold Stocks/Gold Bullion Ratio - Weekly Chart
This chart shows we now have a clean breakout, which is extremely bullish for the price of gold. This signal is not fully confirmed until we have the closing price Friday at 4pm ET.

GDX Gold Miner Stocks Fund - Daily Trading Chart
This chart shows a nice rally to the February resistance level with a small bull flag and a daily close above resistance. Wednesday's price action is very bullish but our support trend line is much to steep for gold stocks to maintain. Those with a high-risk appetite may like this, but I prefer to wait for a more conservative setup.

The USD is Half Way Done It's Move
The Dollar broke down sharply a few weeks ago and is now forming a bear flag chart pattern. This pattern generally forms at the half way point of a move. If the trend continues, we can expect to see much lower prices for the USD in the next 1-2 weeks.

Gold Trading Conclusion:
While gold bullion is looking a little top heavy, the internals like gold stocks and the USD are shouting the opposite. Gold is currently at support, which is generally a good place to add to positions. If the price of gold breaks down from here, there is a clean exit point, which is a daily candle close below the support level on the GLD gold fund chart.
If you would like to receive my trading signal newsletter please visit my website: www.TheGoldAndOilGuy.com.


