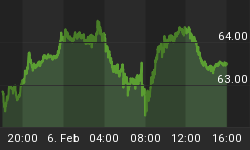
As we should all remember, in early 2008, commodities were on fire as they moved up into their parabolic tops. Of late we have seen a rebound and based on the e-mails that I've been receiving, the crowd is once again turning bullish. Personally, my analysis tells me that commodities are now entering another very critical juncture and how they handle this test will set the stage for months to come.
In review, the CRB topped on July 3, 2008 with an intra-day high at 473.97. By December 5, 2008 the CRB had dropped 56 percent to 208.58 and the final low for the move occurred on February 24, 2009 at 200.16 for a total decline of 57.76 percent. On July 11, 2008 crude oil hit an all time high at 147.27 and the following week my intermediate-term Cycle Turn Indicator triggered an intermediate-term sell signal that remained intact until this past January. Crude oil finally found a bottom on January 20, 2009 at 32.70 for a total decline of 77.80 percent. Gasoline also peaked on July 11, 2008 at 3.63 and a bottom was not made until December 24, 2008 at .785 for a total decline of 78.37 percent. The top in gold came in March 2008 at 1,033 and with a bottom in October 2008 at 681 for a total decline of 34 percent. The XAU also made its top in March 2008 at 209.27 with a minor bottom in May and a secondary high in July. The next low was then reached on October 24, 2008 at 63.52 for a total decline of 69.65 percent. For your convenience I have included these sectors below.


For the record, yes, these tops and declines that followed were called using cyclical analysis, statistical analysis and my intermediate-term Cycle Turn Indicator. Also, each of these recent lows was identified in the same manner. Since the recent intermediate-term low the CRB has bounced 14.67 percent. Crude oil has bounced some 67 percent from its low of 32.70 into its recent high at 54.66 and gasoline bounced 95.80 percent from its low of 78.5 into its recent high of 1.537. From the October low at 681 into the February high at 1,007.50 gold bounced 47.94 percent. From the October low at 63.52 into the recent high of 142.14, the XAU was up a fat 123.77 percent. Point being, when we put a pencil to it, we have seen a fairly decent bounce out of the most recent lows.
However, we have now moved to a very important cyclical hurdle or juncture for these markets. The key for the longer-term outlook of these markets is how well they handle this hurdle. At this time we do not have enough evidence to know for sure if the most recent weakness will turn out to be a buying opportunity or if it is marking the beginning of the end for the recent intermediate-term advance. I can tell you this, caution is advised at this juncture and we should have an answer in the coming few weeks. The key, from my perspective, will be the behavior of the intermediate-term Cycle Turn Indicator and the statistics. As long as the CTI and the statistics are positive, then the intermediate-term move up must still be considered to be intact and higher prices will remain possible. But, any further weakness that also turns the intermediate-term Cycle Turn Indicator negative and/or that causes the statistics on the commodity complex to unfold in a negative light should be followed by yet more weakness. In addition to being at an important cyclical juncture, the other danger I see here is the bullish sentiment and when taken together I do not like the mix. Caution is advised as I await the ultimate confirmation of the indicators.
As for equities, the Dow theory primary trend change that was first confirmed on November 21, 2007 still remains intact. From a Dow theory perspective, the recent bounce must still be considered a counter-trend bounce. The most current Dow theory chart can be found below. The key to this bounce is also the intermediate-term Cycle Turn Indicator and as long as it remains positive, higher prices will remain possible. But, once this indicator turns down, the risk will then return to the downside.

I have begun doing free Friday market commentary that is available at www.cyclesman.info/Articles.htm so please begin joining me there. The specifics on Dow theory, my statistics, model expectations, and timing are available through a subscription to Cycles News & Views and the short-term updates. In the April issue I cover the statistical implications for commodities, gold and the current cyclical and statistical implications for the current advance in the stock market. A subscription also includes very detailed slide show presentation on the big picture in equities, the 4-year cycle, commodities and what is expected to come. I also provide important turn point analysis using the unique Cycle Turn Indicator on stock market, the dollar, bonds, gold, silver, oil, gasoline, the XAU and more. A subscription includes access to the monthly issues of Cycles News & Views covering the Dow theory, and very detailed statistical based analysis plus updates 3 times a week.


