


The good news is:
• Friday, all of the major indices closed at their highest levels since the early March low.
Short Term
Between the low of March 9 and last Friday:
The Russell 2000 (R2K) was up 39.7%.
The NASDAQ composite (OTC) was up 31.9%.
The S&P 500 (SPX) was up 28.5%.
The Dow Jones Industrial Average (DJIA) was up 24.2%.
After 6 weeks straight up, the market is overbought.
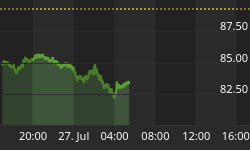
The chart below covers the past 6 months showing the OTC in blue and a 5% trend (39 day EMA) of total NASDAQ volume in orange. Dashed vertical lines have been drawn on the 1st trading of each month.
Volume has been declining for the past 2 weeks of this rally.

As of last Friday, most of the major indices had been up for 3 consecutive days.
The chart covers the past 6 months showing the SPX in red and an indicator showing the percentage of the previous 3 trading days that have been up in green. The indicator touches the top of the chart when all 3 of the previous trading days have been up and it touches the bottom of the chart when all 3 of the previous trading days have been down.
This indicator suggests the next day or two are likely to be down.

Intermediate term
On March 6 there were 827 new lows on the NYSE and 567 on the NASDAQ. Those numbers are big enough to suggest a high likelihood of a retest of the March 9 lows.
Some indicators are showing signs of life that we have not seen in a long time.
The chart below covers the past 2 years showing the OTC in blue and a 40% trend (4 day EMA) of NASDAQ new highs divided by new highs + new lows in red.
This indicator is at its highest level since the October 2007 high.

A problem with new high and new low data is that, at least for new highs, we are looking at some of the lowest numbers on record.
The chart below covers the past 6 months showing the OTC in blue and a 10% trend (19 day EMA) of NASDAQ new highs (OTC NH) in green. The chart looks impressive with OTC NH hitting a 6 month high last Friday.

The chart below is similar to the one above except it covers the past 10 years. Dashed vertical lines have been drawn on the 1st trading day of each year.
OTC NH is still near its lowest levels ever.

Seasonality
Next week includes the week prior to the 4th Friday in April during the 1st year of the Presidential Cycle.
The tables show the daily return on a percentage basis for the week prior to the 4th Friday of April during the 1st year of the Presidential Cycle. OTC data covers the period from 1963 - 2008 and SPX data from 1953 - 2008. There are summaries for both the 1st year of the Presidential Cycle and all years combined.
The program that generates these tables looks for and counts Fridays with market activity. Good Friday usually falls in April throwing the counts off so view the tables skeptically.
Average returns over all years have been modestly negative while average returns during the 1st year of the Presidential Cycle have been modestly positive.
Report for the week before the 4th Friday of April.
The number following the year is the position in the presidential cycle.
Daily returns from Monday through the 4th Friday.
| Year 1 | ||||||
| Year | Mon | Tue | Wed | Thur | Fri | Totals |
| 1965-1 | 0.35% | 0.33% | 0.37% | 0.56% | -0.31% | 1.31% |
| 1969-1 | 0.00% | 0.00% | 0.00% | 0.00% | 0.00% | 0.00% |
| 1973-1 | 0.00% | 0.00% | 0.00% | 0.00% | 0.00% | 0.00% |
| 1977-1 | -0.90% | -0.15% | 0.71% | 0.28% | 0.44% | 0.39% |
| 1981-1 | 0.00% | 0.00% | 0.00% | 0.00% | 0.00% | 0.00% |
| 1985-1 | 0.00% | 0.00% | 0.00% | 0.00% | 0.00% | 0.00% |
| Avg | -0.90% | -0.15% | 0.71% | 0.28% | 0.44% | 0.39% |
| 1989-1 | -0.14% | -0.11% | 0.16% | 0.66% | 0.32% | 0.89% |
| 1993-1 | -1.90% | 1.03% | 0.86% | 0.04% | 0.45% | 0.48% |
| 1997-1 | -1.52% | 0.72% | 1.19% | 0.08% | -1.53% | -1.06% |
| 2001-1 | 0.00% | 0.00% | 0.00% | 0.00% | 0.00% | 0.00% |
| 2005-1 | 0.25% | 1.02% | -0.96% | 2.54% | -1.54% | 1.31% |
| Avg | -0.83% | 0.66% | 0.31% | 0.83% | -0.57% | 0.41% |
| OTC summar for Presidential year 1 1965 - 2005 | ||||||
| Avg | -0.64% | 0.47% | 0.39% | 0.70% | -0.36% | 0.55% |
| Win% | 33% | 67% | 83% | 100% | 50% | 83% |
| OTC summary for all years 1965 - 2008 | ||||||
| Avg | -0.12% | -0.10% | -0.04% | 0.03% | -0.27% | -0.48% |
| Win% | 56% | 48% | 71% | 63% | 52% | 64% |
| SPX Presidential Year 1 | ||||||
| Year | Mon | Tue | Wed | Thur | Fri | Totals |
| 1953-1 | 0.00% | 0.00% | 0.00% | 0.00% | 0.00% | 0.00% |
| 1957-1 | 0.00% | 0.00% | 0.00% | 0.00% | 0.00% | 0.00% |
| 1961-1 | -2.08% | 1.40% | 0.38% | -0.14% | -0.23% | -0.67% |
| 1965-1 | 0.01% | 0.17% | -0.04% | -0.08% | 0.20% | 0.26% |
| 1969-1 | 0.00% | 0.00% | 0.00% | 0.00% | 0.00% | 0.00% |
| 1973-1 | 0.00% | 0.00% | 0.00% | 0.00% | 0.00% | 0.00% |
| 1977-1 | -1.31% | -0.04% | 0.88% | 0.24% | 0.24% | 0.01% |
| 1981-1 | 0.00% | 0.00% | 0.00% | 0.00% | 0.00% | 0.00% |
| 1985-1 | 0.00% | 0.00% | 0.00% | 0.00% | 0.00% | 0.00% |
| Avg | -1.31% | -0.04% | 0.88% | 0.24% | 0.24% | 0.01% |
| 1989-1 | -0.30% | -0.63% | 0.06% | 0.86% | 0.02% | 0.02% |
| 1993-1 | -0.80% | 1.03% | 0.00% | 0.20% | 0.30% | 0.73% |
| 1997-1 | -0.78% | 1.87% | -0.13% | -0.32% | -0.75% | -0.10% |
| 2001-1 | 0.00% | 0.00% | 0.00% | 0.00% | 0.00% | 0.00% |
| 2005-1 | 0.29% | 0.59% | -1.33% | 1.97% | -0.68% | 0.86% |
| Avg | -0.39% | 0.72% | -0.35% | 0.68% | -0.28% | 0.38% |
| SPX summary for Presidential Year 1 1953 - 2005 | ||||||
| Avg | -0.71% | 0.63% | -0.03% | 0.39% | -0.13% | 0.16% |
| Win% | 29% | 71% | 57% | 57% | 57% | 71% |
| SPX summary for all years 1953 - 2008 | ||||||
| Avg | -0.05% | 0.04% | -0.27% | -0.08% | 0.03% | -0.30% |
| Win% | 50% | 52% | 32% | 37% | 55% | 48% |
Money supply (M2)
The money supply chart was provided by Gordon Harms. Money supply growth has been falling.


Conclusion
On March 28, I wrote "It is possible the market could go higher next week, but pretty soon it is going to have to take a rest." I still feel that way.
I expect the major indices to be lower on Friday April 24 than they were on Friday April 17.
This report is free to anyone who wants it, so please tell your friends. They can sign up at: http://alphaim.net/signup.html. If it is not for you, reply with REMOVE in the subject line.
My negative March 28 forecast was a miss.
My hospital visit
I am 64 years old, ran triathlons for 18 years until 6 years ago. For the past 6 years I have been swimming ¾ mile twice a week and walking 3-4 miles a day.
On March 20 we left for a 9 day driving vacation from Minnesota to Texas and Louisiana. I felt a pain in the lower right side of my chest the 1st day on the road and treated it with aspirin. We continued with the vacation although my energy level left a lot to be desired.
When we got back to Minnesota, I called my doctor's office and found out he was in Florida. By this time I had self diagnosed my problem as Pleurisy for which the treatment is antibiotics and pain control. On April 1, I went to a minit clinic where they sent me a way saying if it was Pleurisy I needed an X-ray. I then went to urgent care. When an old man walks into urgent care acknowledging chest pains of any kind they go nuts. They told me to take an ambulance to the ER about a mile away. I refused and signed a release acknowledging my refusal. At the ER they tested me for about 3 hours and concluded there was no problem with my heart and accepted my diagnosis of Pleurisy wrote prescriptions for antibiotics and pain relievers and sent me out the door. That was Wednesday April 1. Friday morning I realized my condition was deteriorating and went back to the ER. Friday afternoon a pulmonogist inserted a tube into my Pleural Sac and removed 960 cc's of liquid, pus from the sounds of it. There was quite a bit of stuff left in my lung and over the next few days they failed to get much more of it. For the next several days the name of the doctor in charge changed several times, but I did not meet any of them. I finally wound up in the hands of a DOC whose job description was "Thoracic surgeon". He cleaned out as much of the goo in my lungs that he could and declared that what I had was pneumonia. I was released after 9 days in the hospital. The prognosis is a slow, but complete recovery in about 6 months. One DOC who stopped by described it as just bad luck.


