


The good news is:
• All of the major indices hit multi month highs last week.
Short Term
Sometimes things are too good to be true and this may be one of those times.
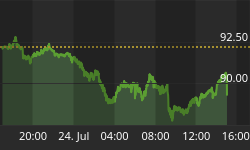
The 40% trend (4 day EMA) of NASDAQ new highs to new lows (OTC HL Ratio) is a good indicator of general market health and it has been positive for about 2 months now. This is good, but last Thursday it hit 92% and backed off a little on Friday to 90.9%. In the past few years when this indicator has broken above 90% it indicates an overbought short term high.
The chart below covers the past year showing the NASDAQ composite (OTC) in blue and OTC HL Ratio in red. Dashed vertical lines have been drawn on the 1st trading day of each month and dashed horizontal lines have been drawn at 10% levels of the indicator.

There were no instances of the indicator breaking above the 90% level during the 07 - 08 period.
The next chart is similar to the one above except it covers the period from June 2006 through June 2007. The arrows point to where the indicator broke above 90 in October 06, November 06 and February 07. There was a minor pullback after the October indicator high, a more severe one following the November indicator high and a very severe decline following the February 07 peak in the indicator.

The next chart is similar to the one above except if covers the period from June 05 through June 06. There were 4 instances of the indicator rising above the 90% level and every one of them was followed by a severe short term decline.

The charts above cover the last 4 years. 6 out of 7 times when the indicator rose above the 90% level it was followed by a severe decline. Breaks from overbought levels measured by this indicator can be severe, but they do not imply and end to the bull run. The market usually recovers quickly.
The only caveat is this few new highs (NASDAQ new highs peaked at 56 last Monday) have never taken the indicator this high.
Intermediate term
The same indicator (OTC HL Ratio) that is indicating a short term overbought condition with a likely pullback also suggests a return to higher highs after the pull back.
Seasonality
Next week includes the week prior to the 2nd Friday of June during the 1st year of the Presidential Cycle.
The tables show the daily return on a percentage basis for the week prior to the 2nd Friday of June during the 1st year of the Presidential Cycle. OTC data covers the period from 1963 - 2008 and SPX data from 1953 - 2008. Prior to 1953 the market traded 6 days a week so that data has been ignored. There are summaries for both the 1st year of the Presidential Cycle and all years combined.
The SPX has been modestly positive during the 1st year of the Presidential Cycle. Returns have been modestly negative by all other measures.
Report for the week before the 2nd Friday of June.
The number following the year is the position in the presidential cycle.
Daily returns from Monday to 2nd Friday.
| OTC Presidential Year 1 | ||||||
| Year | Mon | Tue | Wed | Thur | Fri | Totals |
| 1965-1 | 0.14% | -0.55% | -1.55% | -1.45% | -0.55% | -3.95% |
| 1969-1 | -0.85% | -0.83% | -0.53% | -0.89% | -1.79% | -4.89% |
| 1973-1 | -1.50% | 0.93% | -0.01% | 0.86% | 1.12% | 1.40% |
| 1977-1 | -0.08% | 0.06% | 0.44% | 0.04% | 0.46% | 0.91% |
| 1981-1 | -0.21% | -0.38% | 0.18% | 0.88% | 0.19% | 0.66% |
| 1985-1 | -0.11% | -0.06% | -0.30% | -0.94% | 0.36% | -1.06% |
| Avg | -0.55% | -0.05% | -0.05% | -0.01% | 0.07% | -0.59% |
| 1989-1 | -0.84% | 0.03% | 0.95% | 0.40% | -0.07% | 0.46% |
| 1993-1 | -1.05% | -0.99% | 0.22% | -0.17% | 0.75% | -1.25% |
| 1997-1 | 0.51% | -0.73% | 0.44% | 0.24% | 0.83% | 1.30% |
| 2001-1 | 0.30% | 3.61% | -0.72% | 2.09% | -2.16% | 3.12% |
| 2005-1 | 0.21% | -0.41% | -0.34% | 0.81% | -0.67% | -0.40% |
| Avg | -0.17% | 0.30% | 0.11% | 0.67% | -0.27% | 0.64% |
| OTC summary for Presidential Year 1 1965 - 2005 | ||||||
| Avg | -0.32% | 0.06% | -0.11% | 0.17% | -0.14% | -0.34% |
| Win% | 36% | 36% | 45% | 64% | 55% | 55% |
| OTC summary for all years 1963 - 2008 | ||||||
| Avg | -0.18% | -0.22% | 0.02% | -0.01% | 0.11% | -0.27% |
| Win% | 50% | 28% | 56% | 64% | 63% | 37% |
| SPX Presidential Year 1 | ||||||
| Year | Mon | Tue | Wed | Thur | Fri | Totals |
| 1953-1 | -0.33% | -1.71% | -0.25% | 0.89% | 0.29% | -1.11% |
| 1957-1 | -0.52% | 1.14% | 0.23% | 0.19% | 0.02% | 1.05% |
| 1961-1 | 0.52% | -0.28% | -0.37% | 0.05% | -0.01% | -0.10% |
| 1965-1 | -0.26% | -1.09% | -1.04% | -0.36% | 0.46% | -2.30% |
| 1969-1 | -0.90% | -0.77% | -0.87% | -1.30% | 0.40% | -3.44% |
| 1973-1 | -0.92% | 1.60% | -0.30% | 1.47% | 1.12% | 2.97% |
| 1977-1 | -0.47% | 0.51% | 0.48% | -0.06% | 0.33% | 0.79% |
| 1981-1 | 0.02% | -0.20% | 0.27% | 1.08% | -0.19% | 0.96% |
| 1985-1 | -0.09% | -0.25% | -0.76% | -1.22% | 0.96% | -1.35% |
| Avg | -0.47% | 0.18% | -0.23% | 0.00% | 0.52% | -0.01% |
| 1989-1 | -1.07% | 0.69% | 0.84% | -0.06% | -0.02% | 0.37% |
| 1993-1 | -0.53% | -0.67% | 0.24% | -0.09% | 0.42% | -0.62% |
| 1997-1 | 0.57% | 0.27% | 0.50% | 1.59% | 1.11% | 4.05% |
| 2001-1 | 0.51% | 1.30% | -1.05% | 0.55% | -0.94% | 0.36% |
| 2005-1 | 0.12% | -0.02% | -0.22% | 0.52% | -0.23% | 0.18% |
| Avg | -0.08% | 0.31% | 0.06% | 0.50% | 0.07% | 0.87% |
| SPX summary for Presidential Year 1 1953 - 2005 | ||||||
| Avg | -0.24% | 0.04% | -0.16% | 0.23% | 0.26% | 0.13% |
| Win% | 36% | 43% | 43% | 57% | 64% | 57% |
| SPX summary for all years 1953 - 2008 | ||||||
| Avg | -0.20% | -0.09% | 0.02% | 0.01% | 0.18% | -0.07% |
| Win% | 46% | 41% | 49% | 57% | 61% | 45% |

Conclusion
The market is overbought and likely to correct over the next week or so.
I expect the major indices to be lower on Friday June 12 than they were on Friday June 5.
This report is free to anyone who wants it, so please tell your friends. They can sign up at: http://alphaim.net/signup.html. If it is not for you, reply with REMOVE in the subject line.
Thank you,


