


6/13/2009 6:02:42 PM
The last month or so has been quite a tough period for market timers, the ambivalence in the market has the strength on one day turn into weakness on the next day.
Sideways markets are generally frustrating for both bulls and bears as neither is able to get a real foot hold, and if you buy options during one of these periods, you end up burning the premium you paid for the time component as each day passes with no real result.
So who does well during these times? It's those that have received the premium from selling the options. Whenever an option is bought, someone else is selling it and they're the one that collect the premium paid for the option.
The option buyer hopes that his timing is correct so that he can benefit from the leverage of options and can multiply his money many times over, but. of the 3 things a market can do (up, down or sideways), the option buyer benefits from only one of these moves. On the other hand, the option seller benefits from the other two and as long as the strategy can allow for the possibility that the buyer will be a little right, then the seller has an even higher probability of keeping the entire premium.
Advantage Credit Spreads does exactly this. For example, in mid May, the market was showing signs that it wanted to take a breather, which meant that selling a Call spread was the safer way to go, however the market has a tendency to go against popular belief and so ACS allowed for the possibility of the market heading higher for a while (just in case). The market did in fact go higher to start with but has spent most of the month going sideways and the position has been losing value accordingly (which is what we want).
The bottom line is that ACS does not attempt to capture any particular move in the market, it allows the market to go through its fluctuations and works on a model that gives it approximately a 90% chance of success.
This is the performance for ACS so far this year:
| Jan | Feb | Mar | Apr | May | Jun | Jul | Aug | Sep | Oct | Nov | Dec |
| 6.0% | 8.0% | 4.0% | 2.5% | 6.0% |
To learn more, please click here.
Note, this service can also be auto-traded (without charge) through Think or Swim brokers.
On to the weekly report.
Current Positioning:
SPY: Short 50%
QQQQ: Short 50%
General Commentary:
The system for the QQQQ is 50% into a Sell signal __ __ __ __
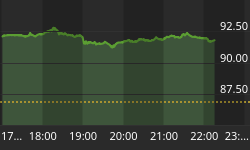
It was another interesting week on the markets, we've been anticipating a drop for a while now but the market is tenaciously hanging on, simply going sideways.
We had thought that a more decisive move would have happened this past week but instead the market was essentially asleep. It's as though it's waiting for something big to happen, just biding its time. Volume was low and momentum seems to be building for a big move one way or the other.
Next week is options expiry and there's a good chance an explosive move will happen during this week. On balance the indicators point to a bearish break and our system is leaning on the bearish side right now. By this time next week things should be clearer for us.
On to the analysis..
SPX Chart - Bigger Picture

So far the bigger picture is staying within the large bearish wedge discussed last week. This means we could get a little more upwards movement in the week ahead but these patterns (in most cases) resolve themselves to the downside. Time will tell.
950 is still a key hurdle, a weekly close above 950 is going to give the bulls the upper hand.
SPX Chart - Shorter Picture

On the one hand, the fact that the market is holding up favors the bulls, but on the other hand, volume has been dropping and the MACD is showing negative divergence to price. When volume picks, that will likely cause a direction to be chosen.
950 has been a clear ceiling so far but the longer this holds up, the greater the chance that we'll get an upside break (even though the indicators don't support this). In order for the bears to gain control, we'll need to see a close below 930 in the week ahead, it's a tough call at this point.
For the week ahead, support on the SPX is 900 - 930 and resistance 950.
NDX Chart - Shorter Picture

The Nasdaq has been extraordinary lately, it looks as though it's defying gravity the way it's hovering higher after the gap up a couple weeks ago.
1500 now holds the keys for the near term, if we get a close above that, the bulls will be in full control, however judging by the MACD (both linear and histogram) the bears still have a very good chance to take control.
For the week ahead, support on the NDX is 1400 - 1440 and resistance is 1500.
The VIX Picture

The VIX actually broke out of its symmetrical triangle last week and now has the potential of setting up a descending triangle, which would be bullish for the markets.
A proviso to this is that the lower figure on the VIX means that people are becoming less fearful and therefore more complacent that rosy times lay ahead. If the participants are in fact becoming complacent, you can bet that wake up call is not far away!
The MACD is indicating that it could go either way, so no matter what happens this week, it's likely to be very interesting.
The VIX measures the premiums investors are willing to pay for option contracts and is essentially a measure of fear i.e. the higher the VIX, the higher the fear in the market place.
Quote of the Week:
The quote this week is from Marcel Proust, "The real voyage of discovery consists not in seeking new landscapes but in having new eyes."
Feel free to email me at angelo@stockbarometer.com if you have any questions or comments.


