


LET'S LOOK AT THE S&P 500 DAILY CHART

The index has rallied one day followed by 4 days of struggling upward and now a wide range day that closed on the low. Volume was very light due to pre-holiday trading and the magnitude of the day is questionable. I am still viewing this rally as a first degree counter trend and allows for a continuation of the downtrend. That means the fast trend can resume. Our forecast called for a bounce from 883 and this bounce was up from 888.
I only see two alternatives now the first is showing support around 880 and the start of a large sideways pattern that will last for the next two or three months with some risk of starting a sharp decline starting around the 19th of July. Or a move to the 847 to 859 level and then moving back up to test the June highs. If the index breaks 847 then the probabilities change to include a higher low as low as 775 but no lower.
LET'S LOOK AT THE WEEKLY CHART

Rallies in bear trends tend to get smaller in both price and time until a final exhaustion. This has occurred at the March low since this current rally has exceeded both price and time of any rally during the campaign. There were also three descending trendlines indicating a "blowoff trend" and once complete (breaking above the 3rd descending trendline) will complete the trend and that has also occurred on this rally. There were also three thrusts down and that can also complete a bear campaign. There are a few negative aspects as the PE ratio for the S&P 500 was higher than any other bear market low and that is illogical considering the fundamental risks. And the "normal" counter trend on the monthly chart is three bars or 90 calendar days and that was the "time" of this last rally. So even though the index has exceeded all the previous rallies it did stop at 90 calendar days and that keeps this rally a possible counter trend rally in a bear trend by the time factor.
The "normal" retracement when changing into a bull campaign is to hit 3/8 of the range down and that has not occurred yet. The "normal" retracement of a rally after the completion of a bear campaign that indicates a possible bull campaign is the 847 level and that hasn't been tested yet.
So there is a strong probability the bear trend is complete but there has been no confirmation of that completion from this rally yet in either "price or time." A weak rally into the 19th to 21st of July could set up another fast move down. We are still looking for support at 880 then a possible run down to around 850 for the low.
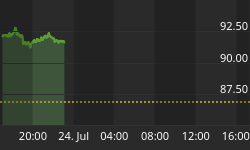
Watch currencies this week the Dollar Index has been struggling down for 18 trading days, very unusual. Struggling trends are always followed by fast trends. Struggling trends can be resolved in either direction. So just be aware of this circumstance and we'll see how this set up during the next report.


