


7/28/2009 2:50:40 PM
The McMillan Portfolio
As of Friday, July 24th, our long term portfolio holds unrealized gains of nearly 91% with an ROI on closed trades of over 230%. The account has achieved gains of nearly 59% in 2009 and we are sitting on over $93K in cash.
As we suggested in our weekly update, we would feature the hourly charts of the Semiconductors and the S&P-500, in order to complete the picture of multiple timeframes. The charts are mostly self-explanatory as they are captioned.

The hourly chart of the semiconductors ushers in two possibilities. There are always at least that many possibilities in a trade, but we have suggested a pull back and a surge to the upper Bollinger Band is likely with the alternative being a break down through support to the lower Bollinger Band. That, in itself provides little idea of how to trade this unless you are a day trader waiting for the 198 level to be hit in order to enter a long trade for a bounce.

The point of this discussion is that the Hourly and Daily charts are in no-mans land at the moment and we would like to see an alignment to get the strongest possibility of a trade, based on technicals, at any rate.
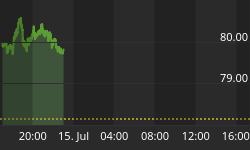
The S&P-500 chart is more interesting. With the Bollinger Bands narrowing, this suggests a larger move is ahead. Think of pressure mounting as a river flows into a narrows. The narrows causes the water to speed up through the narrows and as it passes through the narrows energy is created that is released on the other side, often as white water rapids.
This is the sort of thing we expect, on an hourly basis, for the S&P-500 soon. With that, the Bollinger Bands will once again widen and a larger move is likely.
We have been awaiting a market reversal to the downside, but so have many other traders. Unfortunately, patience has run thin and many traders have entered short trades prematurely. This may cause a final "bubble up" as these traders lose their nerve and cover short positions which would allow us to finally secure a decent entry price. If that doesn't occur, then we would be looking for sideways action to work off the overbought conditions and we would enter new long positions instead of enter a short term short trade.
This is probably a good opportunity to sell covered calls on our Long Term portfolio as we don't currently expect lasting downside action to occur but can make some extra profits by selling into sideways or slightly downward action. Note that a move higher could cause our long positions to be called away from us, albeit at significant profits.
We are going to sell August covered calls for the following symbols, strike price, with the limit prices detailed below:
# of | Stock | Option | Strike | Limit |
1 | PBR | PMJHF | $43.00 | $3.00 |
1 | BNI | BNIHP | $80.00 | $3.75 |
8 | VALE | RIOHU | $21.00 | $0.95 |
10 | IP | IP HD | $20.00 | $2.00 |
3 | RYN | RYNHH | $40.00 | $2.35 |
10 | SFL | SFLHV | $12.50 | $0.75 |
In addition, we are going to take profits on our Short trade of TLT.
Buy to cover 100 shares of TLT at a limit price of $88.00
It might take a while to get filled and we may have to raise the limit if we aren't filled, but it appears to me that we will again see some downside action before the bottom is in.
Long Term Portfolio
Inception Date 10/24/2008
$100,000.00 is allocated to our long term portfolio

Dividends Earned in 2009:
$1,315.00
Dividends Earned/Paid since 6/15/2009:
None
Dividends Earned Total:
$1,841.00
Trade Log:

Commissions Paid: $182.00
As of December 31, 2008
Cash Position | Reserved Cash: | Free Cash: |
$79,883.11 | $49,000.00 | $30,883.11 |
Interest Earned on Cash Balance last month: $232.15
As of July 24, 2009
Cash Position | Reserved Cash: | Free Cash: |
$93,090.62 | $0.00 | $93,090.62 |
Performance for 2008: +1.1%
Portfolio Value on Jan 2, 2009 (Baseline for 2009 performance): $101,191.11
Performance for 2009: +58.8%
Portfolio Value: $160,714.62
Cumulative Performance: +60.7%
There are no fixed stops to this portfolio, but we will actively monitor and manage positions. Cash balances will earn modest interest rates, depending on average daily balance in money market accounts. All transactions are assumed to cost $7 per trade. Each broker charges different amounts per trade, depending on trade frequency, size of the trade, trade type, etc. Check with your broker to determine your actual costs.
Trading (Short/Intermediate Term) Portfolio
Inception Date 05/8/2009 or whenever we initiate the first trade
$100,000.00 is allocated to our trading (short/intermediate term) portfolio.
We still expect to enter trades any day. Please check your email/website to ensure you are able to enter the trades optimally.
Current Positions:
We have yet to initiate positions in this portfolio.
Commissions Paid: $0.00
Interest Earned on Cash Balance last month: $0.00
As of May 18, 2009
Cash Position | Reserved Cash: | Free Cash: |
$100,000.00 | $0.00 | $100,000.00 |
Performance for 2009 (through May 8, 2009): +0.0%
Portfolio Value: $100,000.00
Positions will be entered with primary and secondary target exit prices (with known/assumed profit targets). We will actively monitor and manage positions with the intention to optimize trade entry and exit. Cash balances will earn modest interest rates, depending on average daily balance in money market accounts. All transactions are assumed to cost $7 per trade. Each broker charges different amounts per trade, depending on trade frequency, size of the trade, trade type, etc. Check with your broker to determine your actual costs.
We hope you have enjoyed this edition of the McMillan portfolio. You may send comments to mark@stockbarometer.com.
If you are receiving these alerts on a free trial, you have access to all of our previous articles and recommendations by clicking here. If you do not recall your username and/or password, please email us at customersupport@stockbarometer.com.


