


This essay is based on the Premium Update posted August 22nd, 2009
Various news media reported this week that demand for gold sank to a five and a half year low in the second quarter of 2009 after jewelry consumption dropped by more than one fifth. This sounds discouraging, but before jumping to final conclusions, let's take a closer look at the data itself (courtesy of World Gold Council). Let's keep in mind that journalists can sometimes slant the figures, or ignore those that don't fit their story.

According to the tables, total demand was 9% lower in the second quarter of 2009 than it was a year earlier. However, if we take the first half of 2009 and compare it to the analogous period in 2008, we see that during this time frame demand for gold increased by over 14%.
Some might argue that the investment interest slowed (second quarter of 2009 vs. the first quarter of 2009) as the threat of an economic meltdown receded. But this observation fails to take into account the fact that the investment demand for gold is generally lower in the second quarter (please compare the first two quarters of 2008: 170.7 vs. 151.9 tons). Moreover, investment demand in the second quarter of 2009 is up 46% from 2008.
Applying the same half-year analysis to the investment demand, we get 322.6, and 822.4 tons, which means that investment demand was over 150% higher in the first half of 2009, than in 2008. Since it is investment demand that drives prices in the late stages of a bull market, the fact that this type of demand is picking up is actually very encouraging.
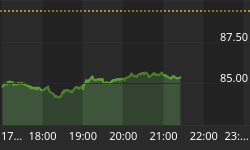
USD Index
In this week's Market Alert I wrote that (...) the USD Index is still below the multi-month trend line, which is visible on the first USD chart from the Premium Update. This long-term trend line is much more important, so the main trend still remains down.

The value of the USD Index (charts courtesy of http://stockcharts.com) moved lower, as I indicated in the last Premium Update, but it is still above the December 2008 low.
The confirmed breakdown below the thick horizontal line is likely to result in a significant move lower. The trend is currently down, and it has just declined after touching the upper border of the declining trend channel. Consequently the odds favor further declines, especially given the fact that the RSI indicator has once again moved lower after reaching the 50 level. The latter development marked a local top during the past few months.
On Friday Nobel Prize-winning economist Joseph Stiglitz said a new global reserve system is needed after the global financial crisis exposed the U.S. dollar-based system as flawed and risky. The "dollar now is yielding almost zero return," Stiglitz said in a speech at the United Nations regional headquarters in Bangkok. "The current global reserve system is fraying. It's falling apart. The issue isn't whether we go to a new system. The question is do we do so in an orderly or disorderly way...It's very hard to have a globally integrated financial system based on a single currency when there's such uncertainties about the economic fortunes of that particular country," he said.
Mining Stocks

The HUI Index (proxy for gold stocks) is currently in a favorable technical situation.
Gold stocks have been trading sideways in the past few weeks and consequently are ready for the next part of the bull market. The recent downswing did not take the mining companies below their long-term support levels, and they are just about to move above their short-term declining trend line.
The Stochastic Indicator has just touched the 20 level. Similar action in the past meant a local bottom. While a double-bottom is not out of the question, my interpretation of the HUI chart suggests that much lower prices are unlikely. A move to the upside looks possible, as the RSI is not even near being overbought, and the same can be said about Stochastic.
The additional signal comes from one of our indicators - the SP Gold Stock Bottom Indicator.

While its value did not reach the dashed line, which would flash a buy signal, it has bottomed very close to it. There are no certainties in any market, but when the abovementioned indicator moved to these levels it was close to a bottom in the mining stocks, not to a top.
Summary
Precious metals declined at the beginning of the previous week, as they got bearish signals from their key drivers - general stock market moved lower, while USD rallied - but the situation changed during the week.
The temporary breakdown in the general stock market was not verified in the following days, and stocks rallied. On the other hand the USD Index moved lower, and is once again trying to break below December lows. It would not surprise me to see it finally manage to do so.
The gold, and gold stock charts indicate higher prices ahead - not necessarily immediately. But they do suggest that even if we go lower temporarily, this move would not be a significant one.
To make sure that you get immediate access to my thoughts on the market, including information not available publicly, I urge you to sign up for my free e-mail list. Sign up today and you'll also get free, 7-day access to the Premium Sections on my website, including valuable tools and charts dedicated to serious PM Investors and Speculators. It's free and you may unsubscribe at any time.


