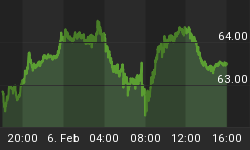
Precious metals like gold and silver appear to be forming a bullish pennant formation, which generally leads to higher prices. Currently the US dollar is hovering around a support level, which is the 76- 79 range. Only time will tell if the US$ breaks down sending gold to new highs in the coming months.
Below is a 4 month spot Gold chart
You can clearly see the pennant formation with gold nearing is apex. Soon enough spot gold prices are going to Blast off or Drop off. I continue to follow the charts closely as we near the apex for a low risk buy signal.

Below is a 4 month spot Silver chart
Spot silver price is forming a similar price pattern. Because spot silver is much more volatile the pennant is a little taller. Again we wait for a low risk setup.

Precious Metals Trading Conclusion:
Precious metals are slowly working their way to the apex of their large multi month pennant formation. In the coming weeks or months I expect to see prices spike much higher with everyone dumping their money into the safe haven GOLD & SILVER.
OR
When spot silver and gold prices start to break down from these multi month pennants we investors will start withdrawing our funds from precious metals at a very fast rate sending prices down.
As always, I keep focused using my low risk-trading model, which helps to alleviate the emotional part of trading during a time like this. Knowing that my down side risk is generally under 3%, this allows me to stay calm and focused. When a trade goes against me, it is not damaging to my account and I review what I have done to be sure I followed my trading system as planned. Losing trades happens all the time in trading, as it's just part of the game. Knowing this, accepting it and keeping losses minimal is what separates profitable traders from the not so profitable traders.
The Energy sector seems to be a mixed bag. The weakness of the US dollar has help to boost the price of oil. Currently crude oil is threatening to break above the June high which will most likely trigger a surge of speculate traders/investors for buy crude oil. If the US dollar does find support in the coming weeks we should see the price of oil slide back down to the $60 per barrel level.
Natural gas as most of you know from my weekly writings is not something I am drooling over yet. It was every exciting two months ago with the bullish breakout but we avoided getting caught in the whipsaw action because of my low risk entry rules which confirm short term strength before we put our money to work.
Below is a 4 month chart of the Crude Oil price
This chart clearly shows momentum is up and the price of oil trying to move higher as it trades at resistance of the June high. We are close to a possible low risk buy signal but depending on the price action this week will dictate what happens.

Below is a 4 month chart of the Natural Gas price
Natural gas I will say has on ugly looking chart. The only observation I can really get out of this is that gas is trading at the bottom of its trading range which is $3.30 area, and the top of the range is $4.20. This is a 27% trading range and could be a great small spec trade at this price level. This type of trade is for a high risk taking trader. I would like to see the price move sideways 1-2 more days here so I know its not making another leg lower from here.

Energy Trading Conclusion:
There are several things which could happen here for oil and gas but in short my thought is if the US dollar continues to slide lower we will sell oil continue to rise and this will help boost natural gas prices some what. Because Nat Gas is at the low of its trading range there is a better chance we will see a higher price in the coming days for a small bounce. Natural gas has been underperforming the price of crude oil for 8 months which has happened in 2006 as well.
I continue to sit on the sidelines and watch the market unfold. Waiting is not the most fun but it is much better to wait than lose money on a bunch of high risk trades repeatedly.
Crude oil could have a low risk setup this week if all things work out. I am neutral on natural gas and not willing to jump on that rollercoaster.
If you would like to receive my Free Weekly Trading Reports please visit my website: www.GoldAndOilGuy.com.


