


9/7/2009 9:02:00 PM
To ensure delivery and prevent this e-mail from being delivered to your bulk mail folder, please add our 'From' e-mail address, info@stockbarometer.com, to your address book or preferred sender list.
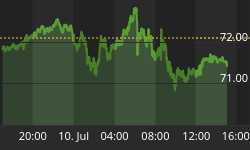
Looking for clues to read the current action.

Stock Barometer Analysis
The barometer has issued a Buy Signal, Placing us in Buy Mode.
The Stock Barometer is my proprietary market timing system. The direction, slope and level of the Stock Barometer determine our outlook. For example, if the barometer line is moving down, we are in Sell Mode. A Buy or Sell Signal is triggered when the indicator clearly changes direction. Trend and support can override the barometer signals.
Stock Barometer Cycle Time
Tuesday is day 1 in our Up Cycle.
The Stock Barometer signals follow 5, 8, 13, 21 and sometimes 34 day Fibonacci cycles that balance with 'normal' market cycles. Knowing where you are in the current market cycle is important in deciding how long you expect to maintain a position.
(Half off - only $25/month for a limited time only)
Using Options to Target Consistent & Conservative Profits - over 80% annualized in 2009!
Potential Cycle Reversal Dates
2009 Potential Reversal Dates: 1/20, 2/11, 3/7, 3/15, 4/8, 4/16, 4/27, 5/7, 6/8, 7/2, 7/17, 9/14. We publish these dates up to 2 months in advance.
We're looking for the markets to movehigher into our next key reverssal date, 9/14.
My Additional timing work is based on numerous cycles and has resulted in the above potential reversal dates. These are not to be confused with the barometer signals or cycle times. However, due to their past accuracy I post the dates here.
2008 Potential Reversal Dates: 12/31, 1/11, 2/1, 2/13, 3/6, 4/5, 4/22, 5/23, 6/6, 6/27, 7/13, 9/2, 10/3, 10/22, 11/10, 12/11. 2007 Potential Reversal Dates: 1/10, 1/14, 1/27, 1/31, 2/3, 2/17, 3/10, 3/24, 4/21, 5/6, 6/15, 8/29, 10/19, 11/29, 12/13, 12/23, 12/31, 1/11/08. 2006 potential reversal dates: 1/16, 1/30, 2/25, 3/19, 4/8, 5/8, 5/19, 6/6(20), 7/24, 8/20, 8/29, 9/15, 10/11, 11/28. 2005 Potential reversal dates: 12/27, 1/25, 2/16, 3/4, 3/14, 3/29, 4/5, 4/19, 5/2, 6/3, 6/10, 7/13, 7/28, 8/12, 8/30-31, 9/22, 10/4, 11/15, 11/20, 12/16.
Spread Indicators
Use the following spread/momentum indicators to assist in your trading of the QQQQ, GLD, USD, USO and TLT. They are tuned to deliver signals in line with the Stock Barometer and we use them only in determining our overall outlook for the market and for pinpointing market reversals. The level, direction, and position to the zero line are keys in these indicators. For example, direction determines mode and a buy signal 'above zero' is more bullish than a buy signal 'below zero'.
QQQQ Spread Indicator (NASDAQ:QQQQ)

The QQQQ Spread Indicator will yield its own buy and sell signals that may be different from the Stock Barometer. It's meant to give us an idea of the next turn in the market.
Provides buying and selling advice with 1/3 Index positioning for trends
use Leverage and our advice as a hedge for your current portfolio.
Gold Spread Indicator (AMEX:GLD)

Want to trade Gold? Use our signals with the Gold ETF AMEX:GLD. Gold gives us a general gage to the overall health of the US Economy and the markets.
Market timing advice for only $10.95/month
US Dollar Index Spread Indicator (INDEX:DXY)

Want to trade the US Dollar? Use our signals with the Power Shares AMEX:UUP: US Dollar Index Bullish Fund and AMEX:UDN: US Dollar Index Bearish Fund.
Bonds Spread Indicator (AMEX:TLT)

Want to trade Bonds? Use our signals with Lehman's 20 year ETF AMEX:TLT. The direction of bonds has an impact on the stock market. Normally, as bonds go down, stocks will go up and as bonds go up, stocks will go down.
OIL Spread Indicator (AMEX:USO)

Want to trade OIL? Use our signals with AMEX:USO, the OIL ETF. We look at the price of oil as its level and direction has an impact on the stock market.
Supporting Secondary Indicator

We daily monitor hundreds of popular and proprietary technical indicators that break down market internals, sentiment and money flow to give us unique insight into the market. We feature at least one here each day in support of our current outlook.
Join Analyst Mark McMillan as he identifies current opportunities
Summary of Daily Outlook
We have a Buy Signal, placing us in Buy Mode. We have a key reversal date looming, it makes sense that the market move higher into 9/14 here - further frustrating the bears.
Friday was a fun day for our day trading experiment - as I had never hosted a live day trading session - but the markets set up almost text book per my day trading eBook, we went long just after 10:10am at 44.9 and the QLD traded up to 46.46. Not a bad day at all...
We may try it again in the future. Anyone who buys the book now will get a transcript of the day and the trade. And if we do it again, you'll be on the distribution to participate...
Click here to get a copy of Jay's new eBook.
If you have any questions or comments, email me at Jay@stockbarometer.com.
Receive 5 Newsletters, including the Daily Stock Barometer, Stock Options Speculator, QQQQ/Rydex Trader, Market Chat & Explosive Stock Alert FOR ONE LOW PRICE.
Weekly Updates on Uptrending stocks in all industries.
$9.95 per month or $95 per year (click here).
Weekly Discussions EVERY MONDAY on 'anything' Trading Related.
$19.95 per month or $189 per year.
Regards,


