


First of all, I would like to call attention to a well written article by J.S. Kim, The Coming Consequences of Banking Fraud. It just so happens to mirror my thoughts, exactly. Those who have been following my subscription services for a while, or even have just started, should realize that I have been quite accurate in my fundamental analysis. Although I am not always 100% on the money with everything, I am within the ballpark 80% to 90% of the time, give or take - which is quite a strong track record. The problem has been over the last quarter or two, that accuracy with the fundamentals has meant relatively little in terms of actual share prices. This means (it always has and always will) that we are in a severe speculative bubble (or conversely a fear driven post crash lull). I think we all know which one it is. It has even gotten to the point where some commenters on the blog claim "fundamentals no longer matter". The last time I heard that preached consistently was right before the dot.com crash, which was notoriously hard to time, but was clear as day in the ability to be seen coming by those who still counted profits and losses.
My research tells me that a large bubble has been blown again, even as the most recent one was still in the process of popping. Like Mr. Kim in the article above, I have found it quite difficult to time the coming if the anticipated bubble pop this 2nd time around (I did successfully and accurately anticipate the bubble being reblown, but severely underestimated the extent, breadth and depth), thus have resorted to market neutral strategies to prevent loss of capital/profits while still keeping my finger on the bearish trigger (see In this difficult to trade market, you have to be more than just right... ). Don't get me wrong. I am not a doom and gloomer, or a permabear. I am a realist. I have absolutely no problem going net long (not market neutral) when I feel the time calls for it. The problem is that the issues that caused last year's market crash (which I pronounced loudly in 2007) have not even come close to being rectified, and as a matter of fact, are in many ways actually worse. In addition, the share prices of many of the companies that are laden with these issues have increased several hundred percent, with many currently hovering at pre-bubble burst prices. This is not the market for a fundamentals guy to go long in. Momentum investors and those who seek fads are currently having their time in the sun, but those who astutely followed the fundamentals are still significantly ahead of the game, by far. It is my belief that if a crash does come, and investors are significantly positioned, those windfall profits will return again, and be predictably manageable because fundamentals will come into play, and not the need to follow stories about high frequency trading, or to catch up with the rest of the market because you were on the sidelines while prices shot up.
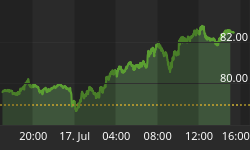
Look at this chart of American Express.

It is trading right about pre-Lehman implosion levels, despite the fact that we have 10% unemployment and rising, with no sign of near term reprieve. Credit card default and charge off rates are near or at historical highs!!! Was Amex really trading that inexpensively during the most recent credit and stock bubble that it should return to those prices now? I won't even bother to comment on the massively insolvent, $183 billion bailout king known as AIG (Worthless companies now rallying several hundred percent in price - What a market for stock pickers) where even the government doubts it will get its money back!
This brings me to the continuation of the study of JP Morgan, and more importantly, not how much it is worth, nor whether it is solvent or insolvent nor too big to fail - but whether it and its brethren are actually too big to let survive - at least in their current form! Before we go on, please see "Why Doesn't the Media Take a Truly Independent, Unbiased Look at the Big Banks in the US?" to catch up on my findings thus far regarding JP Morgan.
In attempting to fine tune the assumptions of the derivatives portion of the JP Morgan forensic model, my analysts explained to me that they were having problems complying with my request that they quantify the losses/gains of JPM through its counterparty transactions due primarily to a lack of reporting clarity and differences across industry lines. I suggested the following...
Since the discretion allowed by management is so wide and malleable, a better tract would be to attempt to ascertain the practical likelihood of JPM actually being able to offset $1.78 trillion of risk and exposure through counterparties who are both credit worthy and not already significantly concentrated in said risk buckets, in addition to those counterparties not offsetting said risk to another counterparty who would be pretty much in the same position. My hunch is that the chance of doing such is highly unlikely. There is just not enough credit worthy capital in the market place that is not already concentrated to offset nearly $2 trillion of risk (and this is just for one company, not the entire market), thus creating an adverse selection scenario. For instance, as the risk started to unwind from the monolines, where did it go? Was it simply left unhedged or was it dumped on other banks or insurers or hedge funds? This is a fundamental question since nearly all participants were deleveraging during this time when the monolines were trying to expel risk and the banks were looking for more counterparties.
Do the banks, who are all deleveraging, actually accept other banks risk? Where is JPM putting $1.8 trillion of hedges? How about the next ten banks in the list of large exposures? Where are they hedging? The only practical answer is that they are hedging with each other, for the same, concentrated risks - which means that those risks are not truly transferred, they are simply share in one big incestuous pool.
Remember, the monolines and insurers were some of the biggest derivative hedge for the banks before they started collapsing.
As a result, we have looked into derivative exposure of top commercial banks to determine if they are hedging with each other to an extent that engenders systemic risk. We have sourced the data from OCC report (attached for your reference, see ![]() occ_q1_2009_derivatives 10/09/2009,01:37 190.49 Kb). Overall derivative products in U.S have grown at a staggering pace rising from $41 trillion by 2000 year end to $202 trillion, or nearly 14.0x of U.S GDP as of March 31, 2009. Of the $202.0 trillion notional value of derivatives in United States, top 5 banks alone account for 96% of the total industry notional amount The high concentration of derivatives among the top five players strongly suggest (this actually being politically correct, realistically it practically assures us) that they may be subject to extreme levels of counterparty risk towards each other. JPM is the largest player in derivative markets accounting for approximately 40% of total notional value of derivatives in U.S. JPM's notional value of derivatives as of March 31, 2009 stood at 39.0 times its total assets and 959 times its tangible equity.
occ_q1_2009_derivatives 10/09/2009,01:37 190.49 Kb). Overall derivative products in U.S have grown at a staggering pace rising from $41 trillion by 2000 year end to $202 trillion, or nearly 14.0x of U.S GDP as of March 31, 2009. Of the $202.0 trillion notional value of derivatives in United States, top 5 banks alone account for 96% of the total industry notional amount The high concentration of derivatives among the top five players strongly suggest (this actually being politically correct, realistically it practically assures us) that they may be subject to extreme levels of counterparty risk towards each other. JPM is the largest player in derivative markets accounting for approximately 40% of total notional value of derivatives in U.S. JPM's notional value of derivatives as of March 31, 2009 stood at 39.0 times its total assets and 959 times its tangible equity.
| Company | Notional Value of derivatives | % of Total Notional Value | Implied market value using JPM's actual as template | Implied hedged amount using JPM's actual as template | Total Assets | Notional Value of derivatives / Total Assets | Tangible Equity | Notional Value of derivatives / Tangible Equity | Implied Counterparty Exposure of Derivatives as Multiple of Tangible Equity |
| JPMORGAN CHASE & CO. | 81,161 | 40.2% | 1,798 | 1,700.05 | 2,079 | 39.0x | 84.65 | 958.8x | 20.1x |
| BANK OF AMERICA CORPORATION | 38,864 | 19.2% | 861 | 814.06 | 2,323 | 16.7x | 65.66 | 591.9x | 12.4x |
| GOLDMAN SACHS GROUP, INC., THE | 39,928 | 19.8% | 884 | 836.34 | 926 | 43.1x | 41.91 | 952.7x | 20.0x |
| CITIGROUP INC. | 29,619 | 14.7% | 656 | 620.41 | 1,823 | 16.3x | 29.67 | 998.4x | 20.9x |
| WELLS FARGO & COMPANY | 1,870 | 0.9% | 41 | 39.17 | 1,286 | 1.5x | 30.33 | 61.6x | 1.3x |
| HSBC NORTH AMERICA HOLDINGS INC. | 3,454 | 1.7% | 76 | 72.35 | 402 | 8.6x | 66.23 | 52.1x | 1.1x |
| Total | 201,964 | 100.0% | 4,316.48 | 4,082.37 |
** JPM had additional collateral at the initiation of transactions of 18,500
Notice how all of the banks on this list probably have at least 100% of their tangible equity exposed through counterparty exposure to, at the most, 5 other highly concentrated, highly correlated and highly incestuous counterparties. Most of the banks have between 12 and 20 times their tangible equity concentrated into this close knit pool. That, my friends, is excessive risk waiting to implode. I am sure there are some of you saying "Well, you don't that they are actually using each other as counterparties". Yeah, right. Who the hell else would they be using? Tell me what group of companies will be able to absorb $4.1 trillion dollars (market value carried on the balance sheet, not notional value) of counterparty risk??? These are the top derivative holding banks here in this list. The weekend Lehman Brothers was failing, who was called in to try and sort out the problem? The top Lehman counterparties. What were their names? Before we go there, note that Bear Stearns, Lehman Brothers and Merrill would be in this list, but they are no longer separate or ongoing concerns as they were before this malaise. As per Bloomberg:
The warning was ominous: "Massive global wealth destruction."
That's what Lehman Brothers Holdings Inc. executives predicted before they filed the biggest bankruptcy in U.S. history. "Impacts all financial institutions," read one bullet point in a confidential memo prepared for government officials obtained by Bloomberg News. "Retail investors/retirees assets are devastated."
The message didn't get through. Two dozen of the world's most powerful bankers, brought together by Treasury Secretary Henry M. Paulson Jr. and Federal Reserve Bank of New York President Timothy F. Geithner the weekend of Sept. 13, 2008, to devise a rescue plan for Lehman, were too busy saving themselves to see the larger threat.
"The discussion among the CEOs was 'How do we prevent the next firm from going under?'" former Merrill Lynch & Co. Chief Executive Officer John A. Thain, who cut a deal to sell his company that weekend, said in an interview. "There should have been much more discussion about the impact directly on the markets if Lehman went bankrupt."
...
For Goldman Sachs Group Inc. CEO Lloyd C. Blankfein, JPMorgan Chase & Co.'s Jamie Dimon and the rest of the financial chieftains who spent a weekend trying to unwind derivatives trades and keep bank-to-bank loans flowing, ignoring the commercial-paper market, the lifeblood of the economy, proved a catastrophic oversight. Within a week, the U.S. stepped in to halt withdrawals from money market funds, leading to a $1.6 trillion industry backstop, part of $13.2 trillion it has committed to beating back the worst financial crisis since the Great Depression.
...
Inviting 'Catastrophe'
One year later, policymakers haven't learned the lesson of the bankruptcy, said Richard Bernstein, CEO of Richard Bernstein Capital Management LLC in New York and former chief investment strategist for Merrill Lynch.
Rather than break up institutions such as Bank of America Corp. and Citigroup Inc., or limit their expansion, the U.S. has given them billions of dollars in tax incentives and loan guarantees that enabled them to grow even bigger. To protect against a bank collapse touching off another freefall, President Barack Obama has proposed regulatory changes that rely on the wisdom of bankers and government overseers -- the same people who created the conditions that led to Lehman's bankruptcy and were unable to foresee its consequences.
"Designating certain institutions as too big to fail, and not having a thorough regulatory process to match, practically invites another catastrophe," Bernstein said.
...
1 Million Bets
On Sunday morning, shortly before noon, Paulson announced that Barclays wouldn't be buying Lehman on any terms, participants said. By then, the bankers had turned their attention to their own survival. Cohn of Goldman Sachs said he led the charge to make sure the banks didn't lose money on derivatives trades either with Lehman or on Lehman.
Derivatives are contracts whose value is derived from stocks, bonds, loans, currencies, commodities or linked to specific events such as changes in interest rates. Lehman had made about 1 million such bets in the over-the-counter market, according to a person with access to that information.
The unregulated $592 trillion market for over-the-counter derivatives, 41 times the size of the U.S. economy, contributed more than half of some banks' trading revenue and had never been tested by the bankruptcy of a major Wall Street firm.
Unwinding Trades
The Fed had already begun trying to untangle Lehman's credit-default swaps on Saturday morning, calling in a group of experts in derivatives operations from Wall Street firms and asset-management companies. They were given one hour to show up at the New York Fed.
Swaps are a way for investors to gamble on whether companies will continue making debt payments or for lenders to buy insurance against borrowers who stop paying. If the company defaults, one side in the bet pays the buyer face value of the debt in exchange for the underlying securities or the cash equivalent.
In order to unwind the trades, the team would need to do so-called portfolio compression, reducing the number of outstanding swaps by eliminating duplication and combining similar bets made by the same counterparties. The process involves sending the trades to an outside vendor, running them through a software program, reviewing the results and deciding which ones to settle.
It couldn't be done, at least not before trading began in Asia on Monday morning, the person said.
Repo Market
On Sunday, the banks called in their own traders to see if they could minimize any losses from dealings with Lehman. That also proved impossible. One snag was that some corporations involved in the trades couldn't get their representatives to the New York Fed in time, said one participant. Another was that many of the banks couldn't determine what bets they'd made on or with Lehman.
A last-ditch attempt on Sunday to try to resolve some outstanding derivatives contracts between Lehman and the other banks at the Fed had little success, according to two people who were in the room. One reason: The banks were only interested in resolving the contracts in which Lehman owed them money and not those where the banks owed Lehman money, said one of the people at the meeting.
The bankers acknowledged that one of their favorite avenues for borrowing would be disrupted by Lehman's collapse. Making sure the market wouldn't freeze for short-term loans called bank repurchase agreements, or repos, was where the participants had their biggest success -- and their bitterest disagreements.
'Default Scenario'
In a repo arrangement, a lender sends cash to a borrower in return for collateral, often Treasury bills or notes, which the borrower agrees to repurchase as soon as the next day for the face value of the securities plus interest. When lenders perceived that Lehman might not pay repo loans or be able to post adequate collateral, they required more and higher quality assets from the firm.
The presentation prepared by Lehman employees, titled "Default Scenario: Liquidation Framework," predicted, among other things, that a bankruptcy would trigger a freeze in the broader repo market.
"Repos default," they wrote. "Financial institutions liquidate Lehman repo collateral. Repo defaults trigger default of a significant amount of holding company debt and cause the liquidation of hundreds of billions of dollars of securities."
Repo collateral caused what might have been the tensest moment of the weekend, according to two participants.
Rule 23(a)
While poring over Lehman's mortgage portfolio on Saturday, former Goldman Sachs partner Peter S. Kraus, a Merrill Lynch vice president and now CEO of New York-based AllianceBernstein Holding LP, accused JPMorgan's Dimon of being too aggressive in demanding more collateral and margin from other banks to cover declining values, according to two people who were there.
JPMorgan, as a so-called clearing bank, holds collateral for other banks in what are known as tri-party repo transactions. When the value of the collateral declines, JPMorgan can require a borrower bank to post more or higher quality assets so the lending bank is protected.
Dimon didn't respond to Kraus, the participants said, and the confrontation died down. Both declined to comment.
The Fed was sufficiently anxious about a standstill in repo funding that on Sunday, Sept. 14, it temporarily modified Rule 23(a) of the Federal Reserve Act to allow banks to use customer deposits to fund securities they couldn't finance in the repo market. That change, scheduled to expire in January, has since been extended through Oct. 30.
Loyal readers, the risk of total systemic collapse has not been removed. I know the stock market is going up, and I have been forced to by my SPX calls and sit in cash not to get beat in the head, but that does not mean that I, nor you, should ignore the reality of this situation. Things are not as they should be. I should be releasing a forensic analysis of JP Morgan sometime next week.
An overview of JP Morgan's Derivative Exposure
| (All figures in $ millions) | 2Q-09 |
| Notional amount of derivative contracts ($ mn) | |
| Total interest rate contracts | 64,604,000 |
| Total Credit derivatives | 6,813,483 |
| Total foreign exchange contracts | 6,977,000 |
| Total equity contracts | 1,392,000 |
| Total commodity contracts | 672,000 |
| Total derivative notional amounts ($mn) | 80,458,483 |
| Gross derivative receivables | |
| Gross value of derivative receivables not designed as hedges | 1,787,991 |
| Gross value of derivative receivables designed as hedges | 9,546 |
| Total Gross fair value of derivative receivables | 1,797,537 |
| Fin 39 netting - offsetting receivables/payables | (1,628,843) |
| Fin 39 netting - cash collateral received/paid | (71,203) |
| Carrying value on Balance Sheet | 97,491 |
| Less: Securities collateral received/paid | (13,796) |
| Derivative , net of collateral | 83,695 |
| Derivative receivables | |
| Level 1 | 2,998 |
| Level 2 | 1,736,643 |
| Level 3 | 57,896 |
| FIN 39 netting | (1,700,046) |
| Total Derivative receivables | 97,491 |
| Less: Securities collateral received/paid | (13,796) |
| Derivative , net of collateral | 83,695 |
| AAA | 16,227 |
| A | 5,712 |
| BBB | 4,240 |
| BB | 6,715 |
| CCC | 1,063 |
| Interest rate | 33,956 |
| AAA | 12,144 |
| A | 4,275 |
| BBB | 3,173 |
| BB | 5,026 |
| CCC | 795 |
| Credit derivatives | 25,413 |
| AAA | 9,008 |
| A | 3,171 |
| BBB | 2,354 |
| BB | 3,728 |
| CCC | 590 |
| Foreign exchange | 18,851 |
| AAA | 3,104 |
| A | 1,093 |
| BBB | 811 |
| BB | 1,285 |
| CCC | 203 |
| Equity | 6,496 |
| AAA | 6,105 |
| A | 2,149 |
| BBB | 1,595 |
| BB | 2,526 |
| CCC | 400 |
| Commodity | 12,775 |
| Total Derivative receivables | 97,491 |
| Less: Securities collateral received/paid | (13,796) |
| Derivative , net of collateral | 83,695 |
| Additional collateral at the initiation of transactions | (18,500) |
| Derivatives, net of collateral and additional collateral | 65,195 |
| % of derivatives transactions subject to collateral agreements | 89.0% |
| impact of a single-notch ratings downgrade | 1,200 |
| impact of a six-notch ratings downgrade | 4,000 |
| Breakup of Derivative , net of collateral | |
| Derivative receivables | |
| AAA | 46,589 |
| A | 16,399 |
| BBB | 12,174 |
| BB | 19,279 |
| CCC | 3,051 |
| Total | 97,491 |
| Derivative receivables | |
| AAA | 47.8% |
| A | 16.8% |
| BBB | 12.5% |
| BB | 19.8% |
| CCC | 3.1% |
| Total | 100.0% |
| Derivatives gains (losses) in income statement | |
| AAA | |
| A | |
| BBB | |
| BB | |
| CCC | |
| Interest rate | (3,451) |
| AAA | |
| A | |
| BBB | |
| BB | |
| CCC | |
| Credit | 820 |
| AAA | |
| A | |
| BBB | |
| BB | |
| CCC | |
| Foreign exchange | 2,348 |
| AAA | |
| A | |
| BBB | |
| BB | |
| CCC | |
| Equity | (62) |
| AAA | |
| A | |
| BBB | |
| BB | |
| CCC | |
| Commodity | 361 |
| Total Derivatives gains (losses) in income statement | 16 |
| Derivatives gains (losses) in comprehensive income | |
| AAA | |
| A | |
| BBB | |
| BB | |
| CCC | |
| Interest rate | (317) |
| AAA | |
| A | |
| BBB | |
| BB | |
| CCC | |
| Credit | 0 |
| AAA | |
| A | |
| BBB | |
| BB | |
| CCC | |
| Foreign exchange | 27 |
| AAA | |
| A | |
| BBB | |
| BB | |
| CCC | |
| Equity | 0 |
| AAA | |
| A | |
| BBB | |
| BB | |
| CCC | |
| Commodity | 0 |
| Total Derivatives gains (losses) in comprehensive income | (290) |
| Gains (loss) as % of avg derivative receivables | |
| AAA | |
| A | |
| BBB | |
| BB | |
| CCC | |
| Interest rate | -8.6% |
| AAA | |
| A | |
| BBB | |
| BB | |
| CCC | |
| Credit | 2.7% |
| AAA | |
| A | |
| BBB | |
| BB | |
| CCC | |
| Foreign exchange | 13.7% |
| AAA | |
| A | |
| BBB | |
| BB | |
| CCC | |
| Equity | -0.4% |
| AAA | |
| A | |
| BBB | |
| BB | |
| CCC | |
| Commodity | 3.0% |
| Total Derivatives gains (losses) in income statement | 0.0% |
| Gains (loss) as % of avg derivative receivables | |
| AAA | |
| A | |
| BBB | |
| BB | |
| CCC | |
| Interest rate | -0.8% |
| AAA | |
| A | |
| BBB | |
| BB | |
| CCC | |
| Credit | 0.0% |
| AAA | |
| A | |
| BBB | |
| BB | |
| CCC | |
| Foreign exchange | 0.2% |
| AAA | |
| A | |
| BBB | |
| BB | |
| CCC | |
| Equity | 0.0% |
| AAA | |
| A | |
| BBB | |
| BB | |
| CCC | |
| Commodity | 0.0% |
| Total Derivatives gains (losses) in comprehensive income | -0.3% |
| % change in gross value of derivative receivables not designed as hedges | -27.7% |
| % change in gross value of derivative receivables designed as hedges | -4.4% |
| % change in gross value of derivative receivables | -27.6% |
| Derivative receivables (change excl writedowns, purchase) | -25.7% |
| Derivative receivables (change incl writedowns) | -25.7% |
| Derivative payables | |
| Gross value of derivative receivables not designed as hedges | 1,747,610 |
| Gross value of derivative receivables not designed as hedges | 1,694 |
| Gross derivative fair value | 1,749,304 |
| Fin 39 netting - offsetting receivables/payables | (1,628,843) |
| Fin 39 netting - cash collateral received/paid | (53,264) |
| Carrying value on Balance Sheet | 67,197 |
| Less: Securities collateral received/paid | (8,744) |
| Derivative , net of collateral | 58,453 |
| Interest rate | 13,583 |
| Credit derivatives | 11,861 |
| Foreign exchange | 19,237 |
| Equity | 12,871 |
| Commodity | 9,645 |
| Total Derivative Payables | 67,197 |
| Less: Securities collateral received/paid | (8,744) |
| Derivative , net of collateral | 58,453 |
| Debt and equity instruments | 56,021 |
| Derivative payables | 67,197 |
| Total trading liabilities | 123,218 |
| Income Statement | |
| Total Fair value hedges | (1,448) |
| Total Cash flow hedges | 55 |
| Total Net investment hedges | (21) |
| Total Risk management activities | (4,624) |
| Total Trading activities | 6,054 |
| Total Derivatives gains (losses) in income statement | 16 |
| Derivatives gains (losses) in comprehensive income | |
| Total Fair value hedges | 0 |
| Total Cash flow hedges | (82) |
| Total Net investment hedges | (208) |
| Total Risk management activities | 0 |
| Total Trading activities | 0 |
| Total Derivatives gains (losses) in comprehensive income | (290) |
| Collateral posted | 67,700 |
| Received collateral | 23,500 |
| Delivered collateral | 5,700 |


