


The good news is:
• The number of new lows remains insignificant.
• The NASDAQ new high indicator continued to move upward ina slightly down week.
• In April the week prior to witching (the coming up week),historically, has been pretty good.
After a strong move like we had in the 8 trading days prior to last week a pause is to be expected. Although there was weakness everywhere except energy, nothing stood out as extraordinary. The NYSE new high indicator is well above the levels required by the most conservative no sell filters and the NASDAQ new high indicator is heading upward.
The intermediate term outlook is positive.
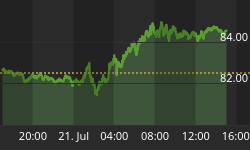
The short term outlook is more difficult to determine. Most of the short term indicators peaked a week ago at very high levels. The chart below is typical. It shows a McClellan Oscillator (difference between 5% and 10% trends) of advancing and declining issues on the Russell 2000 (R2K). The indicator hit a record (for the past year) high a week ago and had nowhere to go but down. Previous near records have been followed by a modest decline then another advance.

For the short term seasonality is positive. The tables below suggest Monday is likely to be down, Friday neutral and Tuesday, Wednesday and Thursday, pretty strong.
Witching report for April.
Witching is futures and options expiration the 3rd Friday of the month.
The number following the year is the position in the presidential cycle.
| R2K | |||||
| Year | Mon | Tue | Wed | Thur | *Fri* |
| 1989-1 | -0.11% | 0.52% | 0.10% | 0.08% | 0.44% |
| 1990-2 | -0.99% | -0.08% | 1.02% | -0.78% | -0.57% |
| 1991-3 | -0.02% | 0.89% | 0.78% | -0.63% | -0.65% |
| 1992-4 | -1.64% | -0.24% | 0.15% | -0.15% | -0.08% |
| 1993-1 | -0.45% | -0.36% | 0.34% | 0.11% | -0.42% |
| 1994-2 | -0.70% | -1.12% | -1.42% | 1.31% | 0.50% |
| 1995-3 | 0.45% | 0.10% | 0.35% | 0.31% | 0.18% |
| 1996-4 | 0.73% | 0.74% | 0.33% | 0.46% | 0.46% |
| 1997-1 | -0.19% | 0.64% | -0.16% | 0.06% | 0.38% |
| 1998-2 | 0.37% | 0.53% | -0.05% | -1.26% | -0.95% |
| 1999-3 | -2.18% | 0.71% | 2.70% | 0.53% | 0.67% |
| 2000-4 | -2.76% | 4.37% | -0.98% | 2.13% | 2.36% |
| 2001-1 | -1.21% | 0.28% | 2.25% | 1.02% | 1.34% |
| 2002-2 | -0.53% | 1.99% | -0.80% | -0.04% | -0.23% |
| 2003-3 | 0.42% | 1.52% | 0.97% | -0.68% | -0.96% |
| Avg | -0.59% | 0.70% | 0.37% | 0.17% | 0.17% |
| Win% | 27% | 73% | 67% | 60% | 53% |
| S&P 500 (SPX) | |||||
| Year | Mon | Tue | Wed | Thur | *Fri* |
| 1989-1 | 0.12% | 1.43% | 0.37% | -0.31% | 1.12% |
| 1990-2 | -1.21% | -0.21% | 0.51% | 0.27% | -1.14% |
| 1991-3 | 0.21% | 1.69% | 0.73% | -0.51% | -1.10% |
| 1992-4 | -1.41% | 0.02% | -0.11% | 0.44% | -0.63% |
| 1993-1 | -0.33% | -0.53% | -0.33% | -0.94% | -0.55% |
| 1994-2 | -0.83% | 0.02% | -0.13% | 1.53% | -0.25% |
| 1995-3 | 0.87% | -0.15% | 0.11% | 0.17% | 0.23% |
| 1996-4 | 0.44% | 0.57% | -0.22% | 0.42% | 0.09% |
| 1997-1 | 0.82% | 1.48% | 1.17% | -0.23% | 0.60% |
| 1998-2 | 0.08% | 0.27% | 0.34% | -0.97% | -1.04% |
| 1999-3 | -2.24% | 1.29% | 2.29% | 1.70% | -0.14% |
| 2000-4 | -0.33% | 3.33% | -1.11% | 0.27% | -0.85% |
| 2001-1 | -1.50% | -1.22% | 1.59% | 0.47% | 1.50% |
| 2002-2 | -0.76% | 2.34% | -0.20% | -0.14% | 0.06% |
| 2003-3 | -0.18% | 2.17% | 0.84% | -0.83% | -1.38% |
| Avg | -0.42% | 0.83% | 0.39% | 0.09% | -0.23% |
| Win% | 40% | 73% | 60% | 53% | 40% |
I expect the major indices will be higher on Friday April 16 than they were on Thursday April 8.
I was overcome by exuberance last week and overlooked the extremely overbought condition of the market. All of the major indices were down, but all less than 1%.


